Ever wondered how the top designers, researchers, and product developers manage to create products that are user-friendly, efficient, and enjoyable—consistently? One of the key things there is what’s called the System Usability Scale (SUS), a vital tool and questionnaire-based method that professionals use in user experience (UX) research and evaluation to see how usable a system or product is, through a series of standardized questions. It’s become a valuable tool in UX design, not least because of how it empowers designers, researchers, and others who work in UX to identify—and then act on—aspects that can improve the user-friendliness and overall quality of the digital platforms they design, so read on and let’s get into the SUS.
What is a System Usability Scale?
John Brooke at Digital Equipment Corporation, in the U.K., developed the System Usability Scale (SUS) in 1986. The SUS has since become a standard way to assess a product’s overall user-friendliness and to evaluate, of course, the usability of digital products including websites and apps—a chief province of UX designers.
What the SUS consists of is ten statements that are related to a user’s experience with a certain product, and there’s a five-point Likert scale, too. The goal here is that you can collect quantitative data that can help you gauge how user-friendly—from the user’s perspective—a system is, and you’ll likely be able to take vital insights from this.
Show
Hide
video transcript
- Transcript loading…
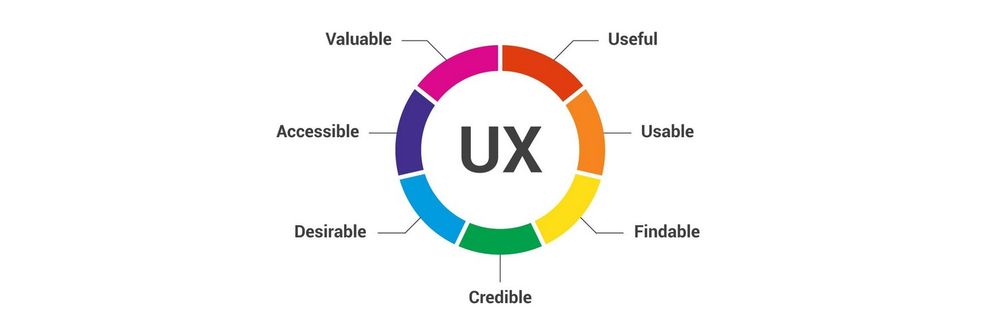
This video explores the vital connection between accessibility and usability, emphasizing how important it is to design products that are accessible to all users, and so improving usability overall, too.
Why is The SUS So Helpful?
Let’s look at some reasons behind the SUS’s helpfulness now:
1. Enhances User-Centered Evaluation
First of all, the SUS is a tool that helps make sure that software and interactive systems like websites and mobile applications fall into line with users’ needs and expectations—that strong emphasis on the user’s perspective makes it a valuable tool in user-centered design and more.
2. Provides Quantitative Measurement
The quantitative analysis aspect is a big help, too, as the SUS features a standardized questionnaire and numerical rating system—bringing in data that makes it possible to make direct comparisons about different systems’ usability, track improvements over time, and set measurable usability benchmarks.
3. Offers Speed and Simplicity
With just 10 questions, the SUS is justly renowned for how simple and brief it is—a factor that makes for quick administration and means it’s a nifty and efficient way of collecting usability data.
4. Facilitates Iterative Design
Because researchers can quickly make good use of the SUS, it means iterative design processes can run smoothly, and it means they can make frequent usability assessments and rapid adjustments to user interfaces, too, which results in more user-friendly systems.
5. Supports Decision-Making
When they’ve got an SUS at work for them, decision-makers can enjoy having an effective way of relying on data-driven insights that are concrete—insights from which they can make informed choices about software and interactive system improvements. What this means is they’re empowered with it to prioritize those enhancements that are going to have a major impact on user satisfaction and the overall usability, too.
6. Enhances Collaboration
Another neat benefit is that the SUS can work as a kind of common language so designers, developers, and users can communicate between each other—and those straightforward and numerical results mean stakeholders can address usability issues that are more out in the open, all in a collaborative atmosphere that helps see further system refinements.
7. Promotes Consistency
Since it’s got a standardized nature, an SUS means there’s more consistency in usability evaluations across different systems and as time goes on—something that translates to there being more reliable insights and decision-making coming out of the efforts.
8. Encourages User Feedback
An SUS has a concise and user-friendly format, and it’s something that lets users conveniently provide feedback on their experiences, so helping brands get in valuable insights right from their target audience.
9. Aids in Resource Allocation
Since SUS data can pinpoint specific areas of software or system functionality that really need attention, it means limited resources can get used towards the maximum impact.
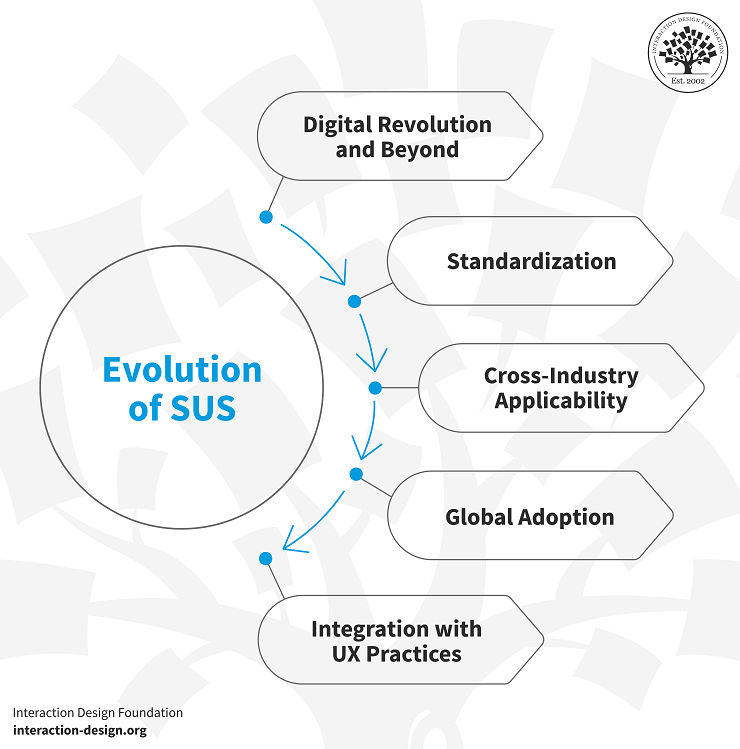
Historical Overview
© Interaction Design Foundation, CC BY-SA 4.0
Digital Revolution and Beyond
The digital revolution—and the rise and expansion of the internet—saw SUS applications getting to expand rapidly beyond the technology tableau that had been around in the 1980s.
Standardization
The SUS gained popularity for its simplicity and effectiveness, and it led to greater standardization in its application.
Cross-Industry Applicability
Over the years, the SUS grew far beyond its original corporate context and shot to the level of being a go-to in the toolkit of usability professionals—who apply this versatile tool across diverse sectors, including healthcare, e-commerce, and education, to name just a few.
Global Adoption
The SUS has achieved true international status—having gone well beyond its English-language roots—and translations and adaptations have made it accessible for usability studies and research all over the planet.
Integration with UX Practices
Since UX has become further and further a household name and grown to massive importance in both product and service design, it’s meant that the SUS seamlessly integrated into UX practices—including iterative design processes—with the assurance of user feedback getting collected and put into product improvements.
Calculating the SUS Score
To calculate the SUS score, you’ll need to follow these steps:
1. Data Collection
To start, get in the responses from a group of users who’ve interacted with your system—and you can do this through an SUS survey, interviews, or online questionnaires—but make sure you’ve got at least 50-60 responses (to get a reliable result).
2. Questionnaire
The SUS questionnaire itself comprises ten statements, each one rated on a 5-point Likert scale, ranging from "Strongly Disagree" to "Strongly Agree." It’s vital that users evaluate their level of agreement with each statement as it stands in accordance with their experience with the system, and here are the statements:
“I think that I would like to use this system frequently.”
“I found the system unnecessarily complex.”
“I thought the system was easy to use.”
“I think that I would need the support of a technical person to be able to use this system.”
“I found the various functions in this system were well integrated.”
“I thought there was too much inconsistency in this system.”
“I would imagine that most people would learn to use this system very quickly.”
“I found the system very cumbersome to use.”
“I felt very confident using the system.”
“I needed to learn a lot of things before I could get going with this system.”
3. Score Conversion
To calculate the SUS score for each respondent: (for odd-numbered statements) subtract 1 from the user's response; (for even-numbered statements) subtract the response from 5.
4. Summation
Add up the scores for all ten statements to get the individual SUS score for each user (it’ll fall within the range of 0 to 100).
Example: If a user's responses are (4, 2, 5, 1, 3, 2, 4, 1, 5, 2), then you’d calculate their SUS test score like so:
Statement 1: 4 - 1 = 3
Statement 2: 5 - 2 = 3
Statement 3: 5 - 1 = 4
Statement 4: 5 - 1 = 4
Statement 5: 3 - 1 = 2
Statement 6: 5 - 2 = 3
Statement 7: 4 - 1 = 3
Statement 8: 5 - 1 = 4
Statement 9: 5 - 1 = 4
Statement 10: 5 - 2 = 3
Total Score = 3 + 3 + 4 + 4 + 2 + 3 + 3+ 4 + 4 + 3= 33
5. Normalization
It’s time to normalize the scores and make them comparable across different evaluations, so, for this, you’ve got to multiply the individual score by 2.5 (in our example, the normalized score would be 33 * 2.5 = 82.5).
6. Interpretation
And so, it’s on to where you’ll interpret the results, and higher scores mean, of course, there’s better usability—and, typically, a score above 70 is a good one, while one that’s over 85 is excellent.
Repeat this process for all your respondents and collect their individual SUS scores, as it’ll help you evaluate your system usability and spot areas where you’ll likely have to improve things.
Here’s an actual SUS survey template—great for making data-driven decisions for a better user experience—that you can use to get that user feedback in and see what the usability of your system is like.
System Usability Scale (SUS) Template
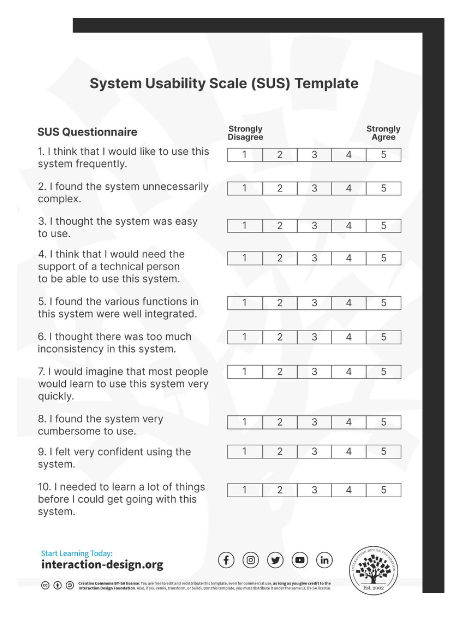
Whether you're a designer, developer, or business owner, the SUS template is a powerful tool for making data-driven decisions for a better user experience.
Pros and Cons of Using a System Usability Scale
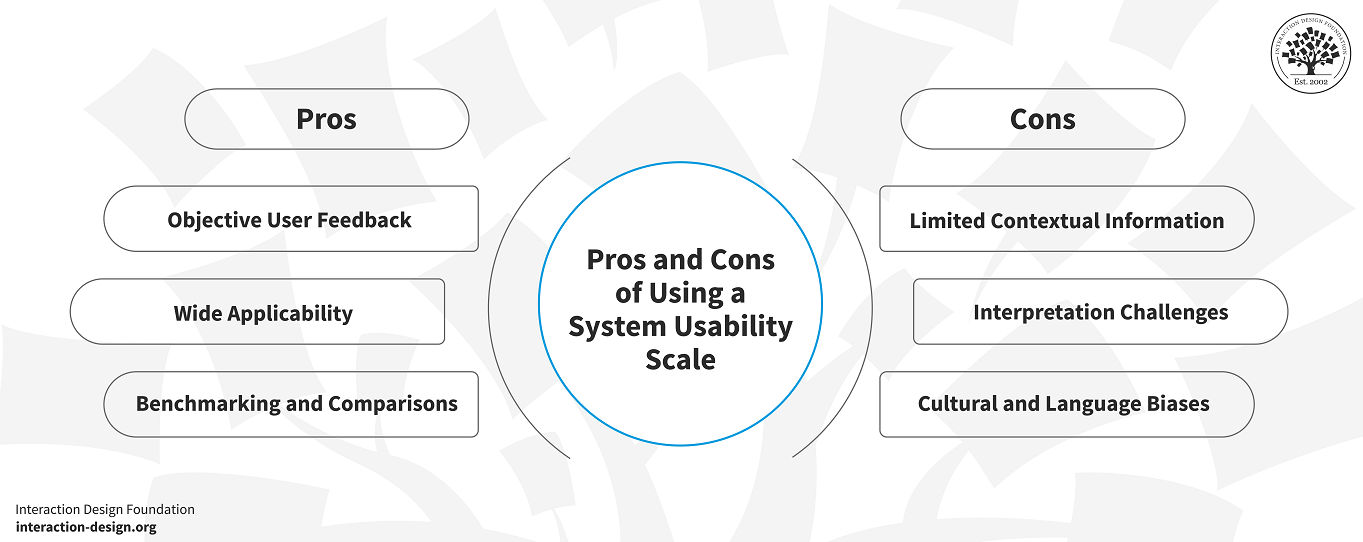
© Interaction Design Foundation, CC BY-SA 4.0
A Practical Guide to Using a System Usability Scale
Step-by-Step Guide to Using SUS
Step 1: Understand the Basics of SUS
Before you start using SUS, make sure you’ve grasped fundamentals of how the SUS works.
Step 2: Define Your Study Objectives
You’ve got to clearly define your study objectives, so be sure you do determine what aspect of usability you’re after to measure.
Step 3: Customize the SUS Questionnaire
It’s important to tailor the language and wording of the questions so it’s in line with your product or service and good and understandable.
Step 4: Recruit Participants
It’s utterly crucial to pick the right participants, so aim for a diverse group of users who represent your target audience, and typically, a sample size of at least 15 participants is good for usability testing with SUS.
Step 5: Administer the SUS Questionnaire
When you administer the SUS questionnaire, do make sure that participants complete it honestly and in conditions that simulate real-world usage—i.e., not in a “vacuum”—say, in task-based scenarios or their simply using the product as they typically would.
Step 6: Calculate and Interpret SUS Scores
After you’ve collected the responses, calculate the SUS test scores for each participant, and a score above 68 is generally considered above average.
Practical Tips and Tricks for Using SUS
Pilot Testing
Before your main study, it’s a great idea to conduct a pilot test with a small group of participants so you’re able to spot and mop up any issues with your questionnaire or evaluation process.
Combine with Qualitative Data
It’s wise to consider supplementing your SUS with qualitative data—such as user comments—so you’ll be able to get deeper insights into what’s going on, working well, and the like.
Iterate and Improve
Use the SUS score as a baseline and continuously assess what’s going on with—and improve—usability, and then repeat usability evaluations from time to time to track your progress well.
Involve Stakeholders
Share SUS results with key organizational stakeholders—the personnel with the power for change are vital resources for you to access and tap here.
Challenges and Common Pitfalls
Here are some common issues to be aware of:
Participant Bias
Participants may feel pressured—say, for politeness’ sake—to give more positive feedback than they genuinely would have done otherwise, say if discussing the product or service with their friends or the like.
Question-Wording
Be careful with your questionnaire design here, and it’s vital to get the wording right, since poorly worded questions can confuse participants or end up with inconsistent responses coming back.
Sample Size
A small sample size can end up getting you less reliable results coming in, so be sure that you’ve got an adequate number of participants for your study.
Interpreting Scores
A higher SUS score generally indicates better usability, sure; even so, though, you’ve really got to consider the context and specific user needs so you’ve got a picture of things in sharp relief before you sort out what’s going on with the scores.
Alternative Research Methods
The SUS is a versatile tool, to be sure, but even so, there are situations where you’ll find that alternative research methods may work better, and here are some good ones:
Heuristic Evaluation
For these evaluations, expert evaluators get down to assessing a product's usability based on recognized usability principles

Thinking Aloud
Users vocalize their thoughts and reactions while they’re using a product, which is a nice and direct way for them to give insight into their thought processes.
User Interviews
In-depth interviews with users are wonderful ways to reap qualitative insights and get feedback.
Task Success Rate
If you’re measuring how successfully users complete specific tasks, you’ll find it can be a valuable alternative way to gauge what’s going on with the usability situation.
A/B Testing
In an A/B test, what you do is compare the performance of two or more design variations to work out which one’s more user-friendly.
The Take Away
If you use a System Usability Scale (SUS), you can find it a powerful tool for evaluating the usability of your products and services, and it’s good to keep these points top of mind:
Define clear study objectives to align your usability assessment with your goals.
Customize the SUS questionnaire to suit your specific needs and product/service.
Recruit a diverse group of participants and administer the questionnaire under realistic conditions.
Calculate and use SUS test scores as a baseline to track usability improvements.
For the next steps after that, that’s where continuous improvement and using alternative research methods—whenever necessary—come into the picture. Do keep in mind that excellent usability is an ongoing process to build up to and that when you combine quantitative and qualitative data, you’ve got a good mix to enhance the user experience of your products and services effectively with. It’ll make it likelier that users can enjoy a better brand release from you when it emerges officially later, all fixed, fine-tuned, and fruitful in the marketplace.
References and Where to Learn More
Learn about the best practices of qualitative user research.