Your constantly-updated definition of The HEART Framework and
collection of videos and articles. Be a conversation starter: Share this page and inspire others!
195shares
What is The HEART Framework?
The HEART Framework is a user-centered methodology that measures the quality of user experience (UX) through five key metrics: Happiness, Engagement, Adoption, Retention, and Task Success. UX designers use this framework to translate abstract user experience goals into concrete, measurable data points that drive product decisions and align teams around user needs.
The HEART framework helps designers empathize with users—and empathy for users is a vital ingredient in design, as this video illustrates:
ShowHide
video transcript
Transcript loading…
What’s at the Heart of the H.E.A.R.T.?
Google researchers Kerry Rodden, Hilary Hutchinson, and Xin Fu introduced the HEART Framework in 2010 through their research paper “Measuring the User Experience on a Large Scale: User-Centered Metrics for Web Applications”—presented at the ACM CHI conference. The framework emerged because of a critical gap which Google’s UX team identified: although measuring user experience on a small scale through observations and interviews was common practice, no established framework existed for measuring user experience on a large scale through automated means.
Kerry Rodden, then Google’s lead UX researcher, developed HEART specifically to help UX design teams focus on a handful of essential areas of user experience while tuning out overwhelming amounts of raw usage data. The research team discovered a strongneed for user-centered metrics that could measure progress toward key goals and drive product decisions in web applications. The framework represented a shift from purely technical metrics to metrics that reflected actual user experience quality; it put people in the picture while keeping business concerns involved—a “magic” balance.
Why Does The HEART Framework Matter to UX Designers?
The acronym “HEART” itself gives a clue. Traditional product metrics often focus on business outcomes like revenue, page views, or system uptime—cold, hard data—but they don’t consider the user’s actual experience. The HEART framework bridges this gap—and brings things to a more human level—by delivering user-centered metrics that allow teams to measure user experience on a large scale. Design teams and other brand stakeholders can take these metrics and use them for decision-making in the product development process. They can help take care of the human dimension of design so much better because of it.
The framework providesa holistic view of UX that makes it easier to balance multiple variables. Since designers and teams can apply it to see, and treat, the user’s experience and their proposed solution as a system, they can achieve a more sophisticated understanding of cause-and-effect relationships between what they include in a design and how individuals respond in their user contexts. That grasp helps lessen the likelihood that designers will make improvements that cause unexpected problems in other areas. Itencompasses both micro and macro measurements to help determine the impact of a product’s user experience. Retention has the most direct relationship to revenue, while other metrics influence overall value.
What makes the framework important is howit connects UX improvements directly to business outcomes. Teams can use HEART to identify essential patterns—such as how if they improve one metric, their effort to do so might weaken another—which helps them understand trade-offs and make strategic decisions about resource allocation. This data-driven approach helps UX designers justify their decisions and demonstrate the business value of user experience improvements. At the same time, when teams create and use tools like personas—fictitious representations of real users—they can fine-tune more accurate pictures of who users are, what they need in a design solution, and which parts of a potential solution would resonate with them.
Explore how personas are more than just helpful for designers and teams—design without them falls short, in this video with William Hudson: User Experience Strategist and Founder of Syntagm Ltd.
ShowHide
video transcript
Transcript loading…
What “H.E.A.R.T.” Stands For – Five Core Principles
The HEART acronym represents five distinct but interconnected aspects of user experience that teams can measure and optimize:
Happiness
Happiness measures user attitudes, satisfaction, and emotional response to the product. It’s a fine place to start. User happiness considers the feelings people have when they’re using a product—companies ask users direct questions to measure satisfaction and fulfillment levels. They typically measure this through user surveys, and satisfaction forms—a key indicator of attitude toward the product. Happiness may seem too challenging a category or a calculation of emotion to optimize—it can seem so unique or idiosyncratic to individual users. Nevertheless, it’s easy to measure through net promoter scores (NPS) and user surveys.
Discover when to use surveys and how they help guide design solutions, in this video with William Hudson:
ShowHide
video transcript
Transcript loading…
Engagement
Engagement tracks how actively users interact with the product. This measures the level of use an average customer gets from the product. It may seem closer to the “cold” business side of analysis and perhaps more “scientific” and readily useful because of it. However, engagement has limited value in enterprise contexts because many users don’t choose to use a system; they have to use it as part of their job. That factor makes engagement less relevant when teams and user researchers examine such systems. Teams typically measure engagement through session duration, feature usage frequency, and depth of interaction.
Adoption
Adoption measures how successfully the product attracts new users and converts them into active users. This part focuses on how successful the product is at acquiring new users and whether they continue using the product after onboarding. Adoption as a category can seem “warmer”—and closer to the “heart”—than more “clinical” ones like task success (below). Teams should be cautious whenever they’re measuring adoption. Not all of it might be because of the design itself. Therefore, design teams might want to share credit with sales and marketing teams to at least keep the peace between their departments, but more importantly as if it’s not possible to tell if design is the main contributor then design teams won’t know if and where they need to improve. Arguably, this factor might extend to other areas, such as engagement.
Retention focuses on keeping existing users engaged over time. Retention involves keeping existing users for a specified amount of time, which might be indefinite for products with long-term utility. Even so, teams typically examine various time scales to identify where user dropout is most pronounced. This HEART metric directly correlates with product value and long-term business success.
Task Success
Task success measures how effectively users can complete their intended actions within the product. Even if a product enables users to complete tasks and they get what they need or want to do done, the time it takes them and difficulty level matter significantly, too. This includes metrics like task completion rates, error rates, and time-to-completion for key user workflows.
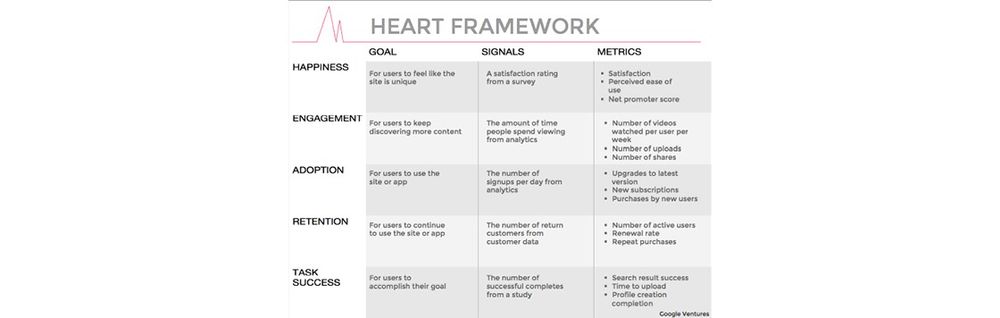
What Brands Do with HEART – The Goals-Signals-Metrics Process
The HEART framework works with a Goals-Signals-Metrics model—which originated at Google—and it provides a straightforward approach to implementation. This three-step process, where each step is just what the title suggests, translates abstract objectives into measurable outcomes:
Goals represent broad, high-level objectives that align with user needs and business strategy. For Happiness, a goal might be to “increase user satisfaction.” When teams set goals upfront, it helps get every team member aligned and puts them in a position where they can decide whether it’s more important to attract new users or increase engagement for existing users.
Signals are observable indicators that suggest progress toward goals. For Engagement, a signal might be “users are spending more time per session in our software.” Such feedback can clearly signal factors for teams to act on. However, teams should ask how easy or difficult each signal is to monitor and whether they’ve designed the product to register relevant actions.
Metrics are the quantifiable data points that provide concrete measurement of success or failure. They answer the question, “By how much?” with good or not-so-good news, and they’re quantifiable data points that indicate success or failure. For example, for happiness, NPS (net promoter score) or number of five-star ratings would be trackable metrics; meanwhile, for adoption, registration rate might be better to follow.
Explore the power of data-driven design and how analytics help designers fine-tune better designs, in this video with William Hudson:
ShowHide
video transcript
Transcript loading…
Video copyright info
Author: Stewart Cheifet. Appearance time: 0:22 - 0:24. Copyright license and terms: CC / Fair Use. Modified: Yes. Link: https://archive.org/details/CC1218greatestgames
How To Use The HEART Framework Step-by-Step
When designers and teams implement the HEART framework, it’s wise to take a systematic approach that begins with strategic planning and moves through measurement and optimization phases.
Step 1: Select Your Focus Area
The HEART framework works best at the product feature level, avoiding use at very low levels like microinteractions or very high levels like entire product families. Narrow the list of goals to no more than three—it’s not practical to focus on every aspect of HEART at once.
Step 2: Choose Relevant HEART Categories
One benefit of HEART is its adaptability; not all projects require all five metrics, so you can concentrate only on what you need to. Therefore, pick metrics based on the outcomes required from the measurement. For example, if you want to improve product stickiness, you might focus on engagement and task success (ET). Still, evaluate which HEART categories make sense for your team to prioritize based on the specific context, such as HER, EAR, or whichever show the results you want to improve on.
Step 3: Define Goals for Each Category
Now, select business goals that align with the prioritized HEART categories. For example, product managers and design teams can ask, “What do we want a customer to tweet after using our product?” to help define goals—if they want users to talk about how easy an app is to use, they can focus on task success.
Step 4: Identify Observable Signals
The signals your team chooses should be ones youexpect to be sensitive to changes in your design and consider how easy or difficult each signal is to monitor. For example, if you want to increase engagement, a signal for that would be more time spent using an app.
Step 5: Establish Quantifiable Metrics
Now, adjust signals into metrics you and your team can track over time or use in A/B testing—the specifics of which will depend on the particular setup. To go back to the engagement example, an appropriate metric might be “average session length.”
Find out how A/B testing can help guide you towards the most promising design decisions, in this video with William Hudson:
ShowHide
video transcript
Transcript loading…
Step 6: Implement Measurement Systems
Once your team has a baseline reading, you can decide which metric is most crucial to improve next. That way, you can iteratively tackle other bottlenecks to strengthen feature UX health over time—such as reducing user frustration with key workflows, increasing task success rates, or deepening user engagement with underused features. This requires setting up analytics tools, survey systems, and data collection processes—and keeping in mind that you’re dealing with a system where improvements in one area can spill over into other areas of user experience.
Step 7: Analyze and Iterate
As each metric improves, your team can iteratively tackle other bottlenecks to strengthen overall UX health above just the features. Regular review cycles can help everyone on the team understand metric relationships and make data-driven decisions about future improvements.
Explore a helpful dimension of how iteration helps teams—in this case, teams using the Agile approach—get effective design solutions out to users faster, in this video with Laura Klein: Product Management Expert, Principal at Users Know, Author of Build Better Products and UX for Lean Startups.
ShowHide
video transcript
Transcript loading…
Best Practices to Help Implement The HEART Framework
Focus on User-Centered Goals
The framework emphasizes user-centered metrics that your team can measure progress toward key goals with and use to drive product decisions. Resist the temptation to choose metrics simply because they’re easy to measure—instead, focus on metrics that truly reflect user experience quality.
Normalize Your Data
Overall numbers naturally increase as user bases grow, sonormalize results using ratios, percentages, and averages per user rather than raw figures. When your team looks at things in proportion, metrics can remain meaningful as products scale.
Maintain Metric Relevance
Keep metric lists manageable—stick to metrics that will actually help make UX decisions. Don’t add “interesting stats” to your list or try to stretch to cover every category of the HEART acronym if it won’t help. Only use numbers that will help you reach decisions.
Encourage Cross-Functional Collaboration
A team effort creates, tweaks, and launches a successful product into the marketplace, so UX designers should spearhead the HEART Framework to establish user goals, while product managers should push to close gaps when frameworks aren’t in place. Implementation works best when the trio of product management, design, and development collaborate throughout the process.
Get a healthy dose of a vital ingredient in design—collaboration between teams—in this video with Laura Klein:
ShowHide
video transcript
Transcript loading…
Regular Review and Adjustment
The data that teams generate over time using HEART can uncover valuable insights about which elements most significantly lead to increased revenue. It can take close monitoring, but the results are worth it to help inform smart decisions about resource allocation. Regular reviews help teams understand these patterns, make sense of the bigger picture, and adjust their focus accordingly.
Special Considerations for The HEART Framework in UX Design
While the HEART Framework provides significant benefits, potential challenges and limitations can affect how successfully a team can implement it.
Metric Interdependencies
The framework can help brands identify essential patterns—such as how improving one metric might weaken another—and teams can (potentially) learn that if they focus resources on increasing user adoption, it might also lower the product’s happiness score. Monitor these relationships carefully. Everything is a system, or a part of a bigger one, so be sure to examine bigger-picture contexts to avoid unintended consequences.
Get a greater grasp of how designers encounter and work with systems in this video with Don Norman: Father of User Experience design, author of the legendary book The Design of Everyday Things, co-founder of the Nielsen Norman Group, and former VP of the Advanced Technology Group at Apple:
ShowHide
video transcript
Transcript loading…
Context-Dependent Relevance
On the subject of context, engagement is of limited value in enterprise contexts because many users don’t choose to use a system—often they’re required to use it as part of their job. Teams must carefully consider the user’s specific context when selecting which HEART categories to prioritize.
Discover how, when you know the context of use, you can tailor more successful designs more effectively to more users, in this video with Alan Dix: Author of the bestselling book “Human-Computer Interaction” and Director of the Computational Foundry at Swansea University:
ShowHide
video transcript
Transcript loading…
Implementation Complexity
Remember, it might seem prudent to focus on every aspect of the HEART framework so your team can build a near-perfect UX design, but it doesn’t quite work that way in real-world terms. It’s not practical to juggle five goals and more than a dozen metrics simultaneously. Teams need proper prioritization and focus if they’re to keep safe from spreading their efforts too thinly and straying into design quagmires where business stakeholders likely become frustrated, too.
Resource Requirements
Implementing HEART takes significant investment in analytics infrastructure, survey tools, and data analysis capabilities. Research and what teams do with data can take a great deal of time, effort, and—indeed—money. That’s why teams must ensure they have adequate resources to collect, analyze, and act on the metrics they carefully choose to track.
Vanity Metrics – Beware
Speaking of “carefully,” teams should ask themselves, “Will these numbers help me make a decision?” and stay focused on metrics related to goals. The temptation to track impressive-looking but ultimately meaningless metrics—which will depend on what aspect of user experience the brand needs to understand—can undermine the framework’s effectiveness and throw the team off track.
Integration with Existing UX Practices
The HEART Framework complements rather than replaces existing UX research and design practices. UX designers and user researchers spend much time observing users, talking to them, and gathering feedback, and they track metrics like load time, crashes, and daily active users. However, nothing happens in a vacuum, especially at the system level of UX design where effects can spill over from one area into another. Teams need a holistic view of overall user experience to make smart product development decisions.
Goals
Signals
Metrics
Happiness
How satisfied users are
Users’ feedback coming from surveys and interviews
Rating (of satisfaction), NPS
Engagement
Content discovery for users
How long users spend in the digital solution
How many page views, shares, average session length
Adoption
Users’ onboarding
Downloads of apps, new features, new registrations
Rates of download, of registration, of adoption of features
The framework is designed for software UX teams—its five elements and Goals-Signals-Metrics model are most logically suited to user experience designers and researchers. However, product managers can find it useful when they prioritize competing projects. Teams can use HEART alongside other UX methods like usability testing, user interviews, and design thinking phases to home in on what’s important.
Check out the phases of the design thinking process and how they help design teams pinpoint effective digital products and more:
ShowHide
video transcript
Transcript loading…
Video copyright info
Hasso-Platner Institute Panorama
Ludwig Wilhelm Wall, CC BY-SA 3.0 , via Wikimedia Commons
The framework particularly excels at bridging the gap between qualitative insights and quantitative measurement. While traditional UX research methods provide deep understanding of user needs and behaviors, HEART gives an extra lift in how it helps teams translate these insights into measurable outcomes that stakeholders can track and optimize over time.
Grab a greater grasp of the powerful research aids, qualitative UX research and quantitative UX research, and how they help inform better designs in different ways, in this video with William Hudson:
ShowHide
video transcript
Transcript loading…
Years after its “debut,” Google’s HEART framework continues to offer valuable insights for measuring and improving user experience. Its enduring relevance stems from its practical approach to connecting user experience improvements with business outcomes through measurable, user-centered metrics. Teams use it also because it has a “heart” for them—empathizing with the point that mind-bogglingly large pools of data can come from research. As teams continue to grapple with increasingly complex data landscapes, they can take heart that when they use the framework properly, they won’t bury themselves under avalanches of numbers and other findings.
The framework and process have generalized to many products and areas—proof that its flexibility lets teams apply HEART principles across various contexts, from individual features to entire product ecosystems. Teams can take up the HEART framework as a powerful tool and leverage it mindfully to determine and optimize what’s important, no matter if they’re working on an app, website, or other kind of experience.
Overall, the HEART framework provides teams with a mature approach to UX measurement, one that balances rigor with practicality. As digital products continue to evolve and user expectations rise amid new contexts and technologies, frameworks like HEART can only become more valuable for teams committed to creating exceptional user experiences. The beauty of HEART lies in how it can help design teams with creating user love and increasing business outcomes.
Ready to shape the future, not just watch it happen? Join the Father of UX Design, Don Norman, in his two courses, Design for the 21st Century and Design for a Better World, and turn your care for people and the planet into design skills that elevate your impact, your confidence, and your career.
Questions related to Heart Framework
Who created the HEART framework, and why?
Google’s UX team—specifically Kerry Rodden, Hilary Hutchinson, and Xin Fu—created the HEART framework. They developed it to help UX designers and product teams measure user experience in a structured and meaningful way.
HEART stands for Happiness, Engagement, Adoption, Retention, and Task success. Each category focuses on a different user-centered aspect of product performance. For example, “Happiness” measures user satisfaction through surveys, while “Task success” tracks metrics like error rates and completion times. The team designed this framework togo beyond traditional usability and capture the full experience of using digital products.
How is the HEART framework different from other UX metrics models?
The HEART framework differs from other UX metrics models by focusing on the user’s perspective and connecting experience metrics directly to product goals. Traditional models often concentrate on system performance or usability alone, like time-on-task or error rates. However, HEART broadens the scope with five user-centered categories: Happiness, Engagement, Adoption, Retention, and Task success.
What makes HEART unique is its flexibility. You can apply it to both feature-level improvements and high-level user journeys. It encourages teams to define clear Goals, Signals, and Metrics—known as the GSM process—too, which creates alignment across design, product, and engineering.
Use HEART when you need a balanced view of emotional and behavioral user data.
Uncover a powerful design tool and ally in user journeys; in this video, Frank Spillers: Service Designer, Founder and CEO of Experience Dynamics, explains key points about user journeys in service design:
ShowHide
video transcript
Transcript loading…
Can I use the HEART framework for mobile apps, websites, and products alike?
Yes, you can absolutely use the HEART framework for mobile apps, websites, and digital products alike. Google designed HEART to be platform-agnostic and scalable, which makes it adaptable to almost any digital context. Whether you’re tracking user retention in a mobile app, measuring task success on a website, or analyzing user engagement in a SaaS product, HEART provides a flexible structure to capture the right data.
The key is to customize the framework’s five categories—Happiness, Engagement, Adoption, Retention, and Task success—to your specific product and user goals. For example, in a mobile fitness app, you might track retention via daily active users and happiness through in-app ratings. For a website, task success could involve form completion rates or checkout success.
How do I apply the HEART framework to a real project?
To apply the HEART framework to a real project, begin by identifying the user experience goals your team values most—such as increasing satisfaction or improving task efficiency. Then, follow the GSM process: define clear Goals, identify observable Signals, and choose quantifiable Metrics for each relevant HEART category (Happiness, Engagement, Adoption, Retention, Task success).
For example, in a project revamping a banking app, set a Happiness goal to improve customer satisfaction. Your signal might be in-app survey responses, and the metric could be Net Promoter Score (NPS). For Task success, you can track login error rates or successful transaction completions.
This structured yet flexible approach ensures teams stay aligned on what matters and lets you track progress over time with meaningful data.
How do I define goals and signals for each HEART metric?
To define goals and signals for each HEART metric, use the GSM method: Goals, Signals, and Metrics. First, establish a clear Goal: a high-level UX outcome you want to improve. Then, identify a Signal:a user behavior or response that indicates progress towards that goal. Lastly, pick a Metric: a measurable way to track the signal over time.
For example:
Happiness: Goal—Improve user satisfaction; Signal—Positive feedback; Metric—In-app survey ratings.
Engagement: Goal—Increase interaction; Signal—Frequent feature use; Metric—Daily active users.
Adoption: Goal—Drive new user activity; Signal—First-time feature use; Metric—New users completing onboarding.
Explore the potential of metrics in our piece on Key Performance Indicators (KPIs), which includes reference to the HEART framework and more.
How do I pick which HEART categories to focus on?
To pick which HEART categories to focus on, start by aligning with your product’s stage, user goals, and business objectives. You don’t need to use all five categories—Happiness, Engagement, Adoption, Retention, and Task success—for every project, and it’s wise to keep a tighter focus, so prioritize the ones most relevant to your current challenges.
For example, if you’re launching a new product, focus on adoption and task success to track how quickly users get started and complete key actions. If you’re improving a mature app, retention and engagement become more critical to measure ongoing value. Use team discussions, user feedback, and analytics to guide your selection.
How often should I track HEART metrics in a product lifecycle?
Track HEART metrics regularly throughout the product lifecycle to make sure your design decisions align with user needs and business goals. In the early development stage, track metrics weekly or biweekly to validate assumptions quickly. After launch, monitor them monthly or quarterly to identify trends and opportunities for improvement.
Note: Different metrics call for different cadences. For example, task success might need frequent updates during usability testing, while retention benefits from monthly tracking to show behavior over time. Use dashboards to automate reporting where possible, and revisit your goals and signals as the product evolves.
This approach helps teams stay proactive—not reactive—about user experience, and keeps them in the driving seat.
Explore the realm of usability testing and find out how it helps direct and boost designs on the right trajectories.
What are the biggest mistakes people make when using the HEART framework?
The biggest mistakes people make with the HEART framework often stem from poor alignment or overcomplication. First, teams sometimes try to measure all five HEART categories at once, which leads to bloated dashboards and diluted focus. Instead, designers are better off prioritizing the categories that align with their product’s goals.
Another common mistake is to skip the Goals-Signals-Metrics (GSM) process. Without clearly defined goals, metrics become vanity numbers that don’t drive meaningful design decisions. Another “danger zone” teams may enter is when they sometimes track signals they can’t influence—like net promoter score (NPS) without understanding what affects it.
Last, but not least, some teams fail to update their HEART metrics as the product evolves. Metrics should grow with the product and reflect shifting user needs, not be stuck as an early snapshot and then set in stone.
How do I measure “Happiness” in the HEART framework?
Happiness may seem a curiously subjective thing that resists measurement, but you can measure “Happiness” in the HEART framework when you gather direct feedback from users through surveys and satisfaction tools. Focus on metrics like Net Promoter Score (NPS), Customer Satisfaction Score (CSAT), or in-app ratings and reviews. These indicators capture emotional responses to your product—how users feel about their experience, not just what they do.
Use short, timely surveys after key interactions (like completing a task or receiving support) to boost response rates and accuracy. Analyze sentiment in user feedback and support tickets to uncover patterns, too. When you track “Happiness,” you can help yourself and your team gauge loyalty, predict churn, and uncover improvement areas that more “clinical” data alone might miss.
Discover how UX surveys can bring in rich data to help you gear designs better around users and take them in the right direction.
How do I track “Adoption” of a new feature or product?
To track “Adoption” in the HEART framework, measure how many new or existing users start using a specific feature or product within a given time frame. Focus on first-time actions—like account creation, feature activation, or onboarding completion. These events signal that users understand the value on offer and are willing to try something new.
Start by defining what “adoption” means for your product. For instance, if you launch a new dashboard, track how many users access it within the first week. Use cohort analysis to see when and how different user groups adopt the feature, and A/B tests to optimize discovery and usability. Strong adoption signals a good product-market fit and validates design choices early in the lifecycle.
Want to see a HEART Framework at work? Take this excellent example—of a design plan for Virtual and Augmented Reality experiences, with Frank Spillers—and come away with a fuller picture of how to get HEART pumping success in your design effort’s direction:
ShowHide
video transcript
Transcript loading…
How do startups and small teams use the HEART framework with limited data?
Startups and small teams can use the HEART framework effectively when they focus on qualitative insights and lightweight metrics. Even without massive data sets, teams can define clear Goals and Signals through user interviews, usability testing, and feedback forms. For example, they can track “Happiness” using in-app surveys or measure “Task success” by observing task completion during remote tests.
Rather than aim for all five HEART categories—which can strain teams’ efforts and cause them to chase sprawling amounts of data—lean teams should pick one or two that align with early-stage goals—like Adoption or Engagement. Then they can collect actionable signals with simple tools like Google Analytics, Hotjar, or direct customer feedback.
Find out more about Lean UX and how it can help teams get on the fast track to effective designs in our article A Simple Introduction to Lean UX.
What are some highly cited articles about the HEART Framework?
This paper introduces the HEART framework—Happiness, Engagement, Adoption, Retention, and Task Success—as a comprehensive approach to measuring user experience (UX) at scale. Developed by researchers at Google, the framework aligns UX metrics with product goals through the Goals-Signals-Metrics (GSM) process. The authors provide practical examples of how HEART has been applied across various Google products, demonstrating its effectiveness in guiding data-driven design decisions. This work has been influential in the field of UX, offering a scalable and user-centered methodology for UX measurement that balances qualitative and quantitative insights.
Earn a Gift, Answer a Short Quiz!
Question 1
Question 2
Question 3
Get Your Gift
Try Again! IxDF Cheers For You!
0 out of 3 questions answered correctly
Remember, the more you learn about design, the more you make yourself valuable.
It's Easy to Fast-Track Your Career with the World's Best Experts
Master complex skills effortlessly with proven best practices and toolkits directly from the world's top design experts. Meet your expert for this course:
William Hudson: User Experience Strategist and Founder of Syntagm.
How to Create Design Plans for Virtual and Augmented Reality Experiences
Whenever you design something new – be it an interface, service or a product– you should start with a plan for what you
593 shares
6 years ago
Open Access—Link to us!
We believe in Open Access and the democratization of knowledge. Unfortunately, world-class educational materials such as this page are normally hidden behind paywalls or in expensive textbooks.
.png)