A picture is worth a thousand numbers.
- Anonymous
People like to look at pictures, and that’s what charts are – pictures of numbers. Pictures attract attention because they are so quickly and comprehensively perceived, in comparison to the time and effort needed to decode words and numbers. Images can act as the sugar of the communication diet. But as with sugar, they can be overused to the detriment of good nutrition, used to distract viewers from otherwise poor content, and liberally applied in ways that make products initially appear to be more informative than they really are. What are the benefits of showing numbers as pictures, and how can these benefits be better applied?
The major innovation of William Playfair was to make numbers more semantically concrete. Concrete is an important semantic concept in its role as the antithesis of abstract. The words “dog,” “wood,” and “student” are concrete, whereas the words “faith,” “quality,” and “childhood” are abstract. Good designers seek concreteness in what they create, so that the non-literal form of a creation serves as an aesthetic expression of its literal purpose or message. The effect is that the building, product, image, or song intuitively “looks”, “feels”, and “sounds” like what it is supposed to do or is trying to say, such that in successful cases it becomes hard to imagine the creation taking any other form. “Appropriateness of form” may be the closest, albeit uninspiring, concept to describe concreteness in action. The “Mind/Hand” construct at the book’s beginning is an example of what is called a “concrete poem”, where the form of the words greatly impact their meaning.
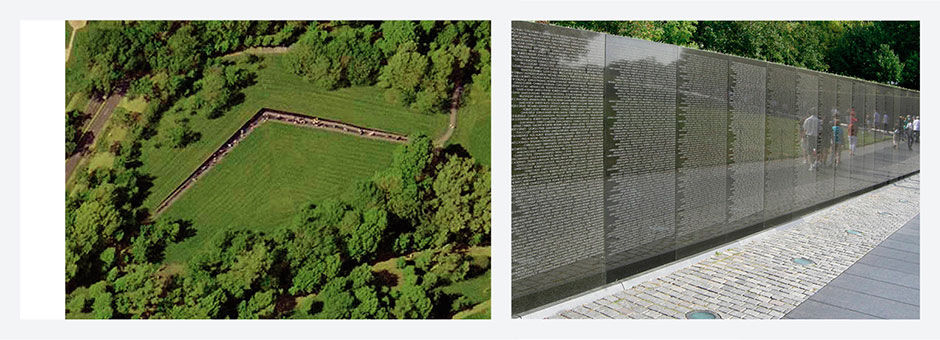
Concreteness can be quite literal, as with post-modern architecture’s famous example of a chicken restaurant taking the form of a giant chicken – or a “duck”, as eponymously referenced in Venturi and Scott Brown’s book Complexity and Contradiction in Architecture. Subtler and more nuanced representations are more typical. My favorite example is Maya Lin’s Vietnam War Memorial in Washington, DC. Reflecting the sense of shame and purposelessness of the war, the memorial appears as if a scar on the landscape, a polished wall emerging from the ground to depict the name of every American killed, appearing in the time-order of their death, growing taller as the quantity of names increase, and then diminishing in height as the casualties trailed off and ended. In this sense it serves as a sort of infographic, albeit an imprecise one, of the gradual wax and wane of the conflict through the key measure of casualties. It conveys the war in a quite abstract way, in its overall form, as well as in perhaps the most literal way possible, by listing the full name of each fallen soldier. Standing at the juncture of the two walls provides a tangible sense of scale regarding what a list of 58,286 names actually looks like. Although met initially with fierce resistance, and since enhanced by a more traditional, literal, heroic bronze figurative sculpture, it is recognized as the most famous and powerful memorial of its type in the world.
Although highly literal and image-laden infographics can be effective, we are still surrounded by heavy-handed misuse of this approach. Lin’s memorial is concrete in conveying an emotional quantitative expression of its subject. The functional trajectory of visual analytics, while not immune from such emotional effects, rather uses concreteness to enhance a more precise, rational, utilitarian understanding of its subject.
 Author/Copyright holder: Fang Hong. Copyright terms and licence: Public Domain, Author/Copyright holder:kkmd. Copyright terms and licence: CC BY-SA 3.0
Figure 5.1: Maya Lin’s Vietnam War Memorial in Washington, DC.
Numbers can be quite concrete when referring to recognizable things in the real world: Three bananas, half an orange, five pounds. But they are also quite generic, formless, and abstract when in isolation. To give numbers a more immediately perceivable form when being used in an abstract sense, we can show numbers geometrically – as proportional plots – versus symbolically – as numerical characters in rows and columns. The abacus is a historical example of this, and today’s graphical charts are becoming more prevalent.
Playfair is famous for seeing how the underlying relevance, essence, or message of printed quantitative data could be conveyed more directly and efficiently by converting the numerical format of rows and columns into a two-dimensional geometric illustration. Numerical figures in rows and columns are recognizable and readable in sequence or by cross-index. However, when converted into geometric plots and color codes, the statistical differences, trends, and outliers in the data become immediately apparent because their form is rendered larger/smaller, bolder/lighter, higher/lower, brighter/dimmer, etc. within the 2D picture plane according to their relative value. This makes the perception of the data much more intuitive and immediate because by presenting the data values in a spatial format, they more closely resemble how humans perceive quantitative phenomena in the natural environment.
The location where things appear in our visual field is the most relevant factor in judging their nature and relevance. This is reflected in graphic design where an item’s position on the page, followed by it´s size, color intensity, and movement are the determining factors in conveying it’s importance and attention sequence. In the real world, things that appear large to us are either actually large, close in proximity, or both. Relative size is important. Is this enemy bigger or stronger than me? Which is the shortest route to my destination? All these judgments are innate and immediate. When analytic quantities are rendered in this way, the same efficiencies take effect. This effect is part of the gestalt theory of perception, and Few explains it in great detail in his book Now You See It.
My first recollection of this effect is from a dinosaur book I owned as a child. One of the key facts about dinosaurs that is relatively hard for kids to grasp is that not only did they live before people ever existed, but they lived WAY before people existed. The age of the dinosaurs is often one of the first encounters kids have with really big numbers, and my book did it in a very concrete way. It had a timeline marking the origin and evolution of life on earth, with the major geologic periods and milestones marked in strips of color. To provide enough space for a scale large enough for the necessary precision, the timeline ran along the bottom of each page throughout the whole book of 20-30 pages. Although its pagination diluted what is referred to as the precognitive effect of seeing a singular, massive timeline, the effect was nonetheless humbling. Precognitive vision refers to the immediate, unconscious, involuntary emotional and attention-directing reaction to visual stimuli. Of course, on the last page, humans appeared in the final inch or so of the strip, and began writing in the last eight of an inch. Using numerical displays or metaphorical descriptions of trips to the moon and back would simply never have impacted me the way that timeline did.
When comparing the numbers 9 versus 10, our precognitive symbolic perception tells us that because the first value occupies about half the visual space of the second, it is greater than 10% smaller. Another example showing the power of visualizing numbers is the familiar 99cent effect in merchandise pricing. When evaluating prices with the same number of digits, we know that $19.99 is almost identical in price to $20.00, but our mind bypasses our voluntary cognition and tells us that the price with larger and odd digits in the right two positions is lower than it really is when compared to one with smaller or even right-hand digits. Pricing expert Mark Stiving did his doctoral research on this effect, and found that in contrast to assumptions that people tend to round down the right-hand digits, they in fact get confused by the difficulties of comparing among prices with right-hand numbers that create slight, yet greater, difficulty of comparison. The reason is known as the cost of thinking – or CoT, an effect quite familiar to any product designer charged with making the use of any product simpler and easier. Stiving’s research did not support the prevailing theory, which is that people perceive $19.99 as being closer in value to $19.00 than it really is due to first reading the 19 and then skipping the calculation of the added .99, Stiving’s research rather isolated the effect to the difficulty involved with calculating more awkward numbers.
Thus, we view rounding down as a process of effort reduction to be used selectively. We propose that such effort-reduction strategies are more likely to be employed when the perceived effort for the subtraction of two numbers is high. That is, when the cognitive resources demanded by a subtraction task are higher than the perceived benefits of performing a correct subtraction, consumers are motivated to reduce the effort involved in the task by resorting to a heuristic like rounding down. In other words, we propose that rounding down is not a routinely performed operation, but is more likely to be performed when the perceived effort for subtraction is high.
The cost of thinking explanation is consistent with left-to-right processing in that price pairs with different left-hand digits are typically more difficult to subtract (i.e. the cost of thinking is higher) than price pairs with the same left-hand digits. For example, 79 minus 71 seems much easier to subtract than 93 minus 79.
[How Consumers Process Price Endings: A Cost of Thinking Approach. Mark Stiving and H. Rao Unnava, June 1998].
 Author/Copyright holder: Mark Stiving and H.Rao Unnava. Copyright terms and licence: All rights reserved
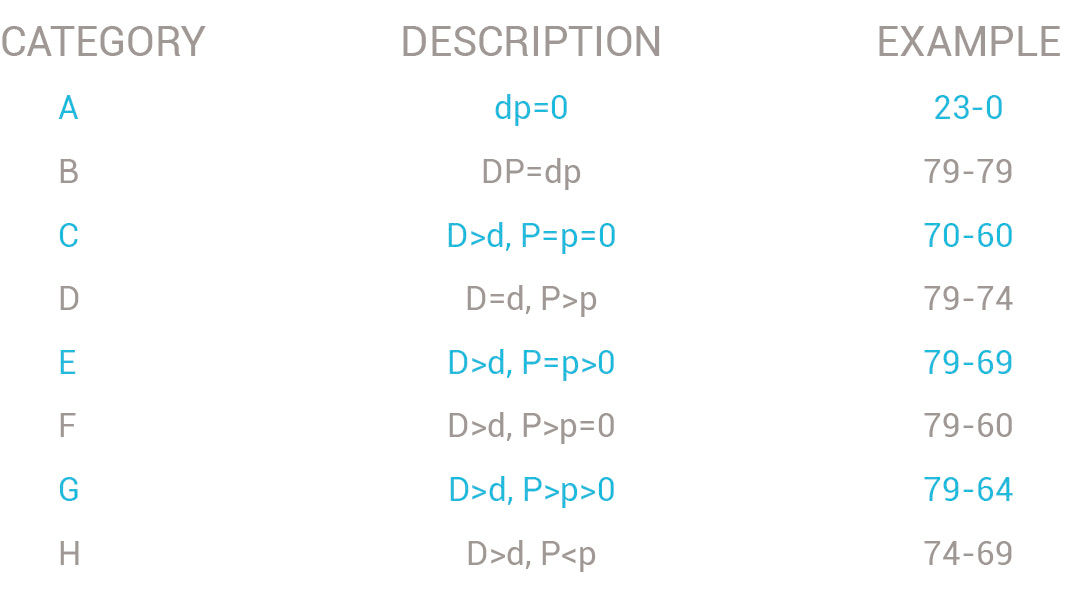
Figure 5.2: The symbol D indicates the dimes digit of the larger number, d is the dimes of the smaller number, P is the pennies of the larger number and p represents the pennies of the smaller number. [How Consumers Process Price Endings: A Cost of Thinking Approach. Mark Stiving and H. Rao Unnava, June 1998].
Stiving actually determined which numerical differences are the most difficult to calculate and thus result in consumers rounding the numbers. In this table, the categories A to H indicate increasingly difficult numerical subtraction calculations.
Product pricing strategies can make the price of a premium product seem to be less than it really is, or vice versa, by intentionally creating a more difficult calculation for shoppers. Were these prices instead presented in adjacent bars within a chart, these small differences would be obvious to viewers and the effect would vanish. And users’ rounding behavior corresponds negatively with their scores for Preference for Numerical Information, or PNI. Predictably, the more comfortable the subjects were with thinking quantitatively, the more they were willing to expend effort on accurate calculations, for with these subjects the required effort was lower. While the instances of this effect occur at very small scales – literally involving rounding errors – their aggregate scale is enormous, and a tangible indication of the errors involved with the symbolic communication of the numeric system. CoT reduction is behind all cases where geometric visualizations of numbers result in faster and more accurate consumer cognition.
Another reason that people have an innate affinity for scale and orientation in two-dimensional space is the fact that the landscapes on which our species evolved have a strong 2D orientation. Of course the earth is spherical, not flat, and its surface undulates with mountains and valleys. But at the scale in which humans have traversed the earth, it is fundamentally perceived as a plane. Early in our history people drew 2D maps, with symbolic indicators of 3D undulations and marked with key features like rivers and villages. Originally these were measured and scaled by memory and intuition until the Greeks invented geometry – literally, “earth measurement”. Although eventually connected to mathematics, logic, and non-cartographic measurement, geometry maintains its semantic root in measuring distance and location on the earth’s surface. Maps are a metaphor and proxy for the land itself, and are obviously invaluable in judging distance, travel time, and overall orientation on the earth’s surface. Because we spent our evolutionary history wandering around on the surface of a primarily two-dimensional model, and because judging distance is a key survival skill, we readily grasp the implications of position and scale in any 2D picture plane. The word for “Map” in French is le plan, from the same Latin root as “plan” and “plane”, further indicating the fundamental importance of two-dimensional geographic representation for data of all types in making sense of human activities.
Originally a cartographer, Jacques Bertin based his visualization theory on the realization that 2D geometry is a powerful way to make abstract numbers more easily perceivable. The geometric plotting and drawing of synthetic data can benefit from the metaphor of cartographic maps. Although Bertin discusses the ways to place quantitative expressions and semantic indications literally onto cartographic maps themselves, his theory goes deeper into the notion of the rectangular picture plane as a more generalizable and abstract map unto itself, traversed by measured grid lines for the plotting of structured data.
Geometric data representation and thinking occurs alongside the parallel system of symbolic thinking – the world of spoken and written language. Along with spatial perception, language is innate to humans and is both a result and a source of how we think. It was these two systems working together that allowed our ancestors to walk around and get stuff done as teams, naming things in the landscape and evolving words, phrases, and languages to help decide what to do. Written language came later, and started out as pictograms that evolved into the abstract letterforms that we know today. Chinese characters still maintain some resemblance to their original pictograms that refer to complete ideas. The symbol for “tranquility” for example evolved from the simple calligraphic figure of a woman within a house. In contrast, Western letterforms became attached to sounds to increase their flexibility and re-use. “A” evolved from an ancient Egyptian pictogram of an ox, through to a Phoenician version – a pictogram of an ox head called “alef” – and eventually evolving to the capital Roman version. If you turn “A” upside down you can see the simple form of a head and horns.
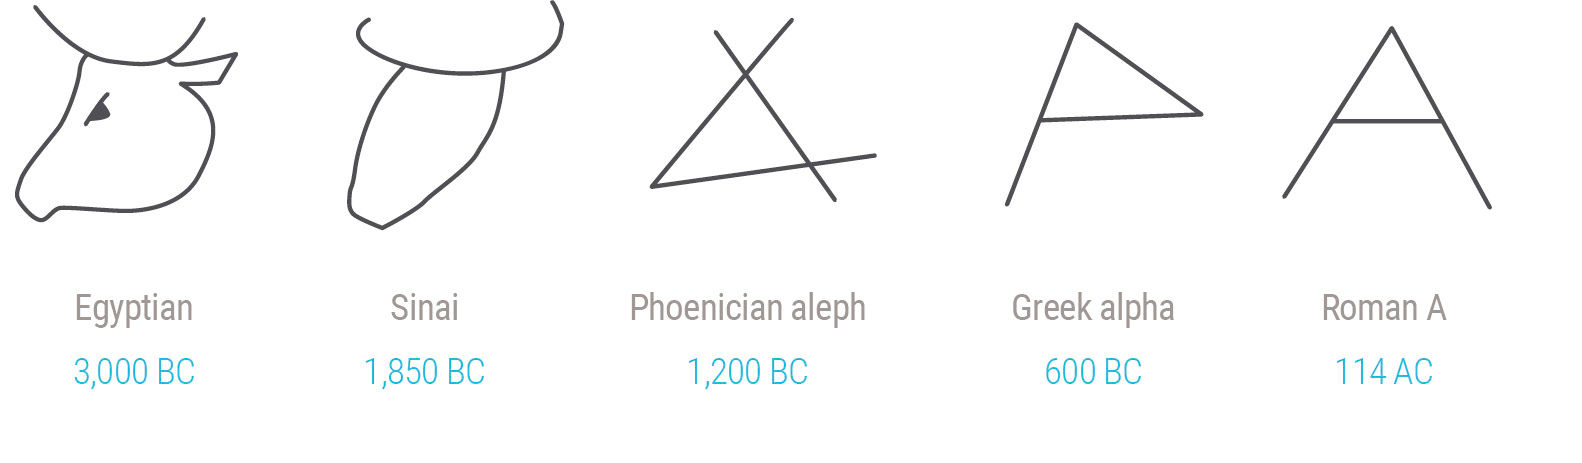
Figure 5.3: Evolution of the letter A.
However, even though letterforms started out as drawings of real things, nobody today sees or thinks of them that way because we have developed the much more efficient technology of symbolic written language, which includes the symbols that represent numbers. While iconographic and other more realistic renderings of things in the world are referred to in semiotic terms as “iconic” representations – the image literally looks like the thing it represents – or “indexical” representations – the image makes the viewer think about the thing it represents in a metaphorical sense – symbolic representation works because, for utilitarian purposes, people decide that an image means a certain thing and then propagate this as a standard. We don’t innately see “A” and think of the sound it refers to in our language. We need to learn that “A” is a symbol for its associated sounds, and after a while need not read and compute the individual letters and sounds of “apple” to decode the meaning – we come to have a precognitive recognition of the word’s shape that we connect to its meaning.
Mathematics has a symbolic language for working with numbers. Western numerals are symbolic in that, with the possible exception of “0” (empty) and “1” (one mark), numerals do not resemble the quantities they refer to. More primitive number notations did this but did not scale well. Think of lots of slashes or dots when large numbers were needed. It became more efficient, if less intuitive, to designate a small group of symbols (0,1,2,3,4,5,6,7,8,9) and a system for scaling them (the base 10 orders of magnitude). Interestingly, numerical notation does exhibit a crude form of spatial expression according to orders of magnitude.
As occurs with words, we come to be precognitively aware that 10 is bigger than 1 in part because it “looks” bigger than 1. Its two digits occupy more visual space. 100 looks bigger than 10, 1000 looks bigger than 100, etc. But because this crude measure increases at a significantly different rate than the actual symbolic value change, it’s a wildly misleading metaphor. 1,000,000 is about seven times larger visually than 1, but is a million times larger in symbolic value. Of course we learn to compensate for this essentially logarithmic scale, but that is yet another cognitive computation we must make.
The use of magnitude abbreviations for number rounding, such as “k,m,b” for thousand, million, and billion, in combination with using a fixed number of digits to suit the required precision — inserting decimal points as needed for scale — alleviates this issue. Because geometric numeric depictions are tedious to draw and do not scale well, symbolic numerical notation is dominant, and geometric notation is reserved for when it is most needed, typically as a supplement or appendage to larger expressions. Written characters, essentially letters and numbers, are a code that needs to be deciphered in the mind. The digit 4 is not visually twice the size of the digit 2, but because of a shared understanding, or convention, literates understand the symbols and do the conversion in their head. The numeric symbol system, and its mathematical framework of the rows and columns in a table, of course have tremendous value for other reasons, but immediate precognitive visual recognition is not their strength.
Just as semiotician Roland Barthes said, “nothing is so boring as an unnamed landscape”, a map without labels is of limited use. The real power of human thought comes from attaching symbolic language to things and activities in the physical world and using this language to effect desired outcomes. Much of the craft involved in visual analytics is in the harmonic merger of geometric – or visual – content, and symbolic – or written – content, in a single picture frame. The discipline of graphic design hinges on this craft, and it was not until 20th century printing and digital composition capabilities became available that the full potential for seamless text and image integration could be realized on a production scale. Historically, the two were necessarily isolated in layouts because of the separate and unique composition and production processes for type and images. This resulted in the convention of long passages of prose set in rows and columns of type, interspersed with boxes containing pictures or drawings. While not always impossible to print these two forms overlapping each other, primitive image control made for crude and obscure results. However, the simple ability to juxtapose and interrelate words and images on a picture plane is of course quite powerful. The problem with maps is that the words need to be IN the image, not around it, and this is often the case with geometric numerical displays as well.
Despite these differences, strictly numerical analytic displays are in fact visual. They are consumed through our visual sense and exhibit a system of layout and format conventions that convey important aspects of the underlying data. The Cartesian model (x and y axis, or grid) of spreadsheets uses position within the two-dimensional display plane as an orientation, or navigation, indicator to assist in cross-indexing of the desired numerical values, with added conventions as to the location, meaning, and function of titles, sums, etc. The geometric size of items and their position within the display have nothing to do with their numeric size, except for the crude, somewhat arbitrary factors of large numbers appearing somewhat larger due to having more digits, or sums typically appearing in end rows or columns and perhaps being rendered in boldface numbers.
In contrast to this, in charts the data values are plotted visually on a scale so that the size and position of the visual elements are determined by their associated data values. Large values appear as long bars, and points appear higher or farther right, or as a larger dot within the space of the display. Hybrid techniques also exist, such as heatmaps, which use color spectrum values instead of position or size to indicate quantity or type values of an element. The color dimension can be overlaid onto tables or spatial plots, with colors indexed to mean certain values, in order to add another dimension to an expression. In actuality, color/pattern coding and the iconic symbols used as scalar, categorical quantitative indicators – think of good/bad/neutral status indicators such as the “thumbs up, thumbs down, thumbs sideways” hand gestures, or red/yellow/green “traffic lights”– are symbolic indicators as they rely not upon size but rather learned convention for comprehension. They are less reliable for use across cultures because this symbolic meaning can vary with context. A major benefit of using image size to signify actual size is that bigger and smaller are universally understood.
So, while numerical and tabular displays are in fact visual analytics, it’s the unique power of geometric and iconic/color-coded displays that Playfair espoused, and this is what most people mean by information visualization, and what I mean by visual analytics.
While Few’s work begins to look at the implications of digital displays for visual analytics, and the HCIL has focused on its intersection of engineering, computer science, and ergonomics, I believe that some fundamental innovations need to occur to bring the value of visual analytics to a significantly larger audience. Just one look at the current digital landscape tells us that something has changed, and that some rules for visual analytics need to change as well. How can quantitative thought benefit from and adapt to a communication landscape dominated by websites, email, e-commerce, mobile devices, big data, and social media? We can get clues by looking at how and why visual analytics are relevant, and how innovation in general happens.
The growing sophistication of information technology has transformed how we access and interact with money, products, news, messages, and images, but has yet to truly impact how we consume and understand quantitative information, or numbers. I’m skeptical about technology’s ability to change basic human behaviors, but I believe it to be a major driver of cultural change in general, and of both the functional and stylistic evolution of our built environment in particular. For a good example, take the span.
Being able to span and/or cover space with a road or a roof has obvious benefits, and the history of this capability closely follows the history of civilization. There has long been a strong demand to cross valleys or bodies of water with a conduit structure, or encompass wider or taller internal spaces. It’s easy for a designer to specify that a bridge cross the Golden Gate, or that a dome cover the vast centralized space of a Byzantine church, but of course much harder to engineer a solution to make the designs a reality. However, if the benefit is real, and if designers and their clients continue to value the aspirational designs, then an incentive exists for a technical solution to satisfy the specification and answer the need. This tireless search drove the invention of everything from post-and-lintel construction and the arch to flying buttresses, pre-stressed concrete, and the geodesic dome. What makes architecture such a vivid example of technological advance is its public and visible nature, which, unlike invisible embedded products like sewer systems or silicon chips, demands that aesthetic virtue and human factors exist in harmony with engineering. Perhaps the most stirring example of brilliant design and engineering combined with aesthetic greatness is the story of Italian renaissance architect Filipo Brunelleschi and his design for the massive dome of Florence Cathedral, completed in 1436.
Upon completion, Florence Cathedral had the largest dome in the world at the time, and for hundreds of years nobody knew exactly how the secretive architect did it. Scholars have now discovered the unique brick-based construction methods that enabled Brunelleschi to guarantee that his design would not collapse during construction, despite not using traditional wood-framed support scaffolding. His proposal’s acceptance was made more unlikely by the fact that at the time he was not a proven architect or structural engineer, but rather a metalsmith, fresh off of losing one of the most famous art commission competitions in history. However his client, the city of Florence, was desperate. They had completed the entire cathedral except for the dome, all the while knowing that the technology did not yet exist for a dome of the specified size. Because the cathedral took decades to construct, they had assumed that by the time the dome was needed someone would have figured out , and already demonstrated, how to do it. His solution, described in a PBS Nova TV episode, is fascinating.
This dynamic has been in place for thousands of years in structural engineering, as well as in countless other pioneering disciplines that are constantly testing the envelope of performance in the pursuit of timeless goals. Moore’s law of computing power’s acceleration is the main instantiation of the effort in the high technology arena. Requirements and specifications lead engineering and technology. The implication is that ideas are cheap, obvious, and plentiful and that the market decides which ideas deserve the funding to be engineered and implemented.
Technological advancement also has side effects, secondary applications, and potentials that are not initially obvious but are made apparent gradually over time. The presence of a new technology, especially when combined with other new but previously unrelated technologies, can enable the design of products and services that deviate from the steady advance of directed technical development, or even that were never before imagined. Technology gets funded and developed for the known use case of greatest potential benefit. The internet is a prime example, originally a military application and now a mass communication and commerce medium. Java is another, originally a mobile device programming language that developed into a cross-platform virtual machine and application programming environment. The iPod was famously cobbled together from mostly commercially-available parts, requiring only the vision and the will to combine them into a product. Technology enables and drives innovation in design and, by extension, culture and civilization. The implication is that technology eventually trickles down through society, combines with other technologies, and creates opportunities for those creative and curious enough to exploit them, consciously or not.
This is not to say that the creators of the technology are those best suited to imagine and decide how it is to be used. Alan Cooper’s book The Inmates are Running the Asylum argued that software products of the late 1990s suffered from poor user experiences because engineers made all the design decisions, ignoring user needs in favor of self-interested engineering concerns. This is but a recent example of the general 20th-century transition from an economy and management ethos led by manufacturing to one led by marketing and, increasingly, by design, as famously demonstrated by the prominence of designer Jonathan Ive at Apple.
The phenomenon is active at the highest and lowest levels, from civilization in general to the simplest development project. The most dramatic historical example I know of is the impressionist painting movement of the late nineteenth century, one of the most dramatically innovative movements in art history.
Impressionism, with its vivid painted depictions of fleeting moments, is perhaps the most widely popular art genre today, and often credited as the first example of the modern art movement. But what caused such a broad group of mainly French artists to adopt a similar but radically different approach to painting at the same time and place? The answer is technology. The newly invented photographic process was dramatically lowering the price of creating realistic images, which forced many painters into more personalized and unique ways of interpreting reality, especially with the use of color. The industrial revolution created wealth and a middle class with leisure time, widening both the pool of dabbling artists and the audience for fine art interest and purchases. Steam trains made travel easier, enabling painters to reach more outdoor destinations. Finally, an evolving scientific understanding of relativity and time itself began to change concepts of reality and how to depict it.
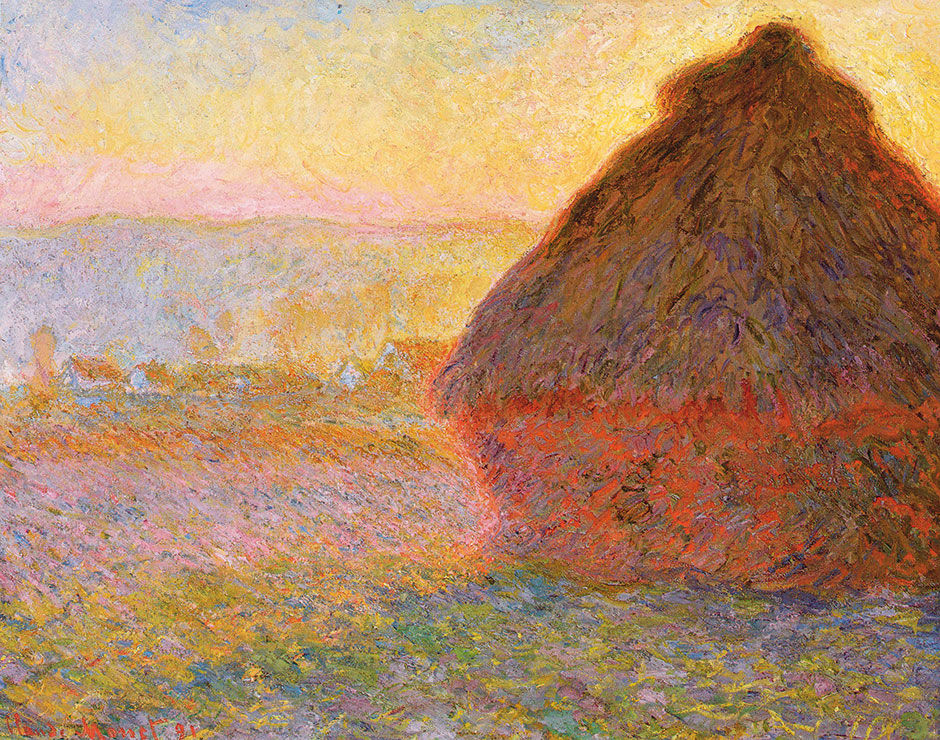
Figure 5.4: Claude Monet, Haystacks, (sunset), 1890–1891 Museum of Fine Arts, Boston.
Perhaps most relevant was the availability of pre-mixed paints sold in metal tubes. Previously, artists mixed their own paints, and needed a studio for the necessary space and materials to do so. Landscapes were sketched on site and then painted back in the studio from memory, one reason that many pre-impressionist paintings by comparison look muted and brown. The impressionists, free to carry their kit anywhere and work quickly, could paint a canvas outdoors in one sitting, enabling the style and technique that made them famous. As the movement’s name implies, their paintings were quick impressions of otherwise nondescript places, people, and points in time from the perspective of the individual artist. The point is that while the technologies did not directly create the artistic inspiration, when combined they enabled an environment for breakthroughs of expression and form. The fast and fleeting nature of their creative process reflected the time’s accelerating pace of life, while at the same time demonstrating the sublime beauty available for free in the world at all times and places, if only the effort is taken for it to be seen and appreciated. In this sense, as with all great art, it served to unlock hidden value and wisdom and deliver it to all viewers, regardless of their wealth, power, or beliefs.
Another more recent example comes from my birthplace of Columbus, Ohio. During the 1970s and 80s The Ohio State University had a contract with the US Navy to use a supercomputer to build 3D maps of the ocean floor for use in submarine warfare. When a few art students discovered how the computer could render virtual form, they negotiated time on the computer during down times at night, when they could experiment with creating original forms of their own. Under the leadership of Professor Charles Csuri, this evolved into a prominent computer graphics lab that helped invent the 3D rendering technology used today for design, manufacturing, and entertainment. And of course the internet started as a national defense communication network.
While I’m not yet impressed with CGI’s ability to generate innovative artistic expressions anywhere near the level of the impressionists – with the possible exception of Pixar films which I believe will be looked back on as masterpieces of the medium – some of the most popular and visible applications resulting from the original technology would have been difficult to imagine, let alone predict, had it not already been bootstrapped by the government. As with the Internet, certainly the investment necessary to build such a capability could have never been singularly funded so decisively on the prospects of blockbuster movies or commercial Computer-Aided Design – or CAD – systems. While specific technologies are developed for associated practical use cases, and calculated to pay back the investment, eventually these inventions trickle down to secondary use cases. Either alone, or when combined with other unrelated technologies, they enable innovations that were previously unimagined, or imagined but deemed to be impractical. There is however a delay between when technology is made available and when people realize, through research or from just living with the new capability, the potential of trickle-down and combinatorial innovations.
Entire civilizations can stagnate when not presented with incentives and opportunities to change. Under the dynastic rule of the Pharaohs, the artistic style of the ancient Egyptians went essentially unchanged for almost three thousand years after its basic visual language was established around 3000 BC. With no threats to their political hegemony, and the reliable annual cycle of the Nile river to fertilize the agricultural flood plain and maintain a steady food supply, there was no real reason to invent or create anything new. China, once it was consolidated into roughly the geographical boundaries we know today, and made relatively safe behind its wall, was content to lay low and go about life under its sequence of dynastic rulers. Without chronic economic or military challenges from other nation-states – albeit with fierce and brutal internal political struggles – China was content to maintain a relatively primitive state of technological sophistication, despite the obvious ability to innovate as exhibited by their early invention of paper, printing, and firearms. Accordingly, China’s artistic innovation remained relatively static during this time as well.
This conclusion can be contested if we look at other examples taken from both the highest and lowest scales of endeavor. In the former case, we might conclude that technology advances are themselves a result of a higher-level or unrelated design vision, or that a near-universal utopian dream design is guiding all innovation at some level – like biology’s Intelligent Design, but driven by the collective mind of civilization. There is also science fiction, where artists imagine products and capabilities transcendent of current technology, and sometimes these visions end up being built. Dick Tracy’s radio watch comes to mind, new versions of which were a big part of the 2014 holiday promotions. Skynet and its combat robots from the Terminator movies are none other than visions of today’s relatively primitive drone aircraft. At the lower levels, say within a product design cycle, the technologies used to deliver the product are, or at least should be, only chosen in reaction to the product’s form and behavior design specification. The product design assesses the currently available technology and, if it is to ship, must either limit its dependency to these capabilities, or prescribe that new capabilities be created within the scope of the project itself.
The dynamic that I find most interesting falls in between these two extremes, where technology has enabled products that nobody planned for, or thet enables disruptive, positive change for existing products that are not immediately apparent. It seems to happen almost unconsciously. I’m sure the impressionists did not collectively say to themselves ahead of time “hey, let’s go to the beach with our new portable kits and make crazy new paintings in a few hours with colors right out of the tube”. They drifted into it on their own, unconsciously behaving and creating in new ways by virtue of the changing world around them. They discovered each other’s work, and started hanging out and sharing ideas. They were actually driven together, as most were bitter at having their work be rejected by the Salon des Beaux Arts, the time’s academically rigid gatekeeper of artistic style and fame.
In contrast to ancient Egypt and China, civilizations like classical Greece and post-renaissance Western Europe exhibited comparatively dramatic innovations in technology, politics, and the arts. Historians Jared Diamond and Francis Fukuyama partly attribute this to an overall fragmentation of power structures, caused by factors like geography and religion, which spurred competition and conflict. Rival political bodies raced for technical, economic, and military superiority to ensure survival. Alongside this was the struggle for the spiritual and cultural “hearts and minds” of the populace, which drove a parallel artistic arms race to present the most convincing models of existence, and demonstrations of strength and power to win converts and maintain confidence.
The visual arts of painting, sculpture, and architecture are powerful ways to project power, vision, and ideology to a population. They are concrete, visible, relatively permanent, and a facile vehicle for storytelling, especially given the low literacy rates of medieval Europe. Europe’s great cathedrals are festooned with meticulously placed figures, scenes, and visual narratives of Christianity to serve as a readily consumable canon of the faith. In this regard, the visual arts were a technology of sorts, not only in the sense of materials and architectural engineering, but through techniques like representational rendering, visual hierarchies and spatial arrangement, and the increasing sophistication of simulating three-dimensional space and passage of time on two-dimensional surfaces. It’s easy to forget that pictorial staples such as linear, occlusional (overlapping), and atmospheric perspective needed to be invented and refined over centuries.
Art history in the West has exhibited cycles of innovation where, based upon external societal stimuli, the output goes on a directional run of innovation where considerably new expressive forms are developed along a certain theme, until the movement runs its course by approaching perfection. The high renaissance in Europe is an example of this. Having produced a series of innovations leading to the likes of Michelangelo and Leonardo Da Vinci, it was difficult to pursue the same line of creation and do appreciably better at it. Having reached a sort of purity of expression, the only way forward for artists to innovate is through some sort of initial counter-movement or reaction, but executed within the same overall artistic model. Art historians call this phenomenon Mannerism. Unable to top the achievements of the existing movement’s high masters, and lacking any technical breakthroughs to open up new fundamental possibilities, they begin to distort and add whimsical flourishes to the same fundamental themes and forms used by the previous genre. With results typically not as spectacular as the culmination of the previous genre, art from a mannerist period seems to run in circles, examining and re-examining itself and its predecessors until emergent societal stimuli enable a fundamentally new artistic movement.
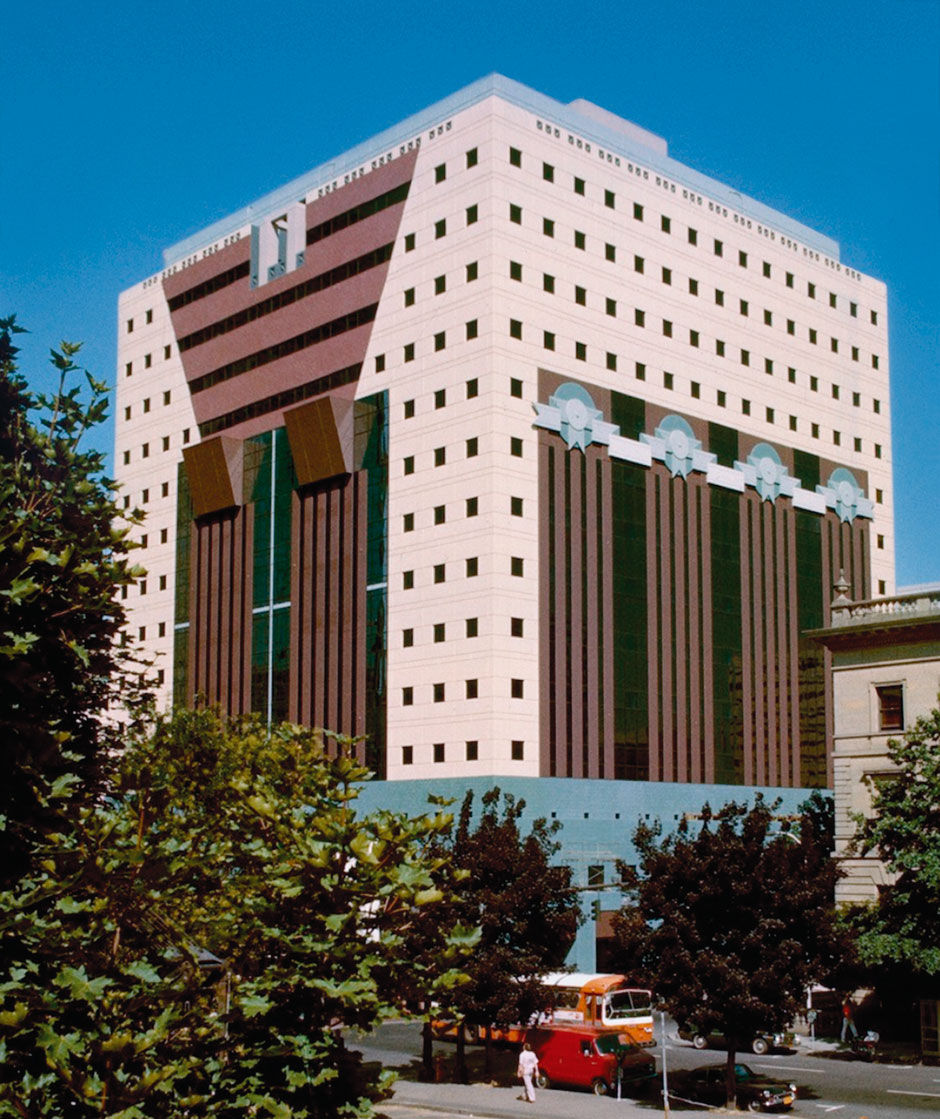
The post-modernist, or pomo, movement of the 1970s and 80s is a good example of mannerism. As a reaction to minimalist modernism having become, well, too minimal, pomo architects and designers liberally repurposed whimsical stylistic elements from history’s parts bin – such as arches, towers, columns, faux surfaces, etc. – with little functional or structural purpose but rather for semantic and symbolic reasons. Concurrently, and not culminating until the new possibilities of digital content distribution, graphic design’s avant garde ran itself into a cul-de-sac of distressed, distorted, barely legible self-absorption. Not until new stimuli, such as the opportunities of a vastly more powerful computer-aided design capability, and new constraints such as design for sustainability, did pomo give way to newer forms. The Web in the late 1990s opened up graphic communication to a new practicality, based on much simpler but wildly more efficient distribution channels.
 Author/Copyright holder: Steve Morgan. Copyright terms and licence: CC BY-SA 3.0
Figure 5.5: Portland Building, an example of Postmodern architecture.
The communication design frontier shifted from an arms race of ever-more-freaky graphic expressions to the practical task of figuring out dynamic multimedia, and how to functionally and cognitively enable the delivery of practical news, communication, commerce, and productivity through the strictly graphic channel of the computer screen.
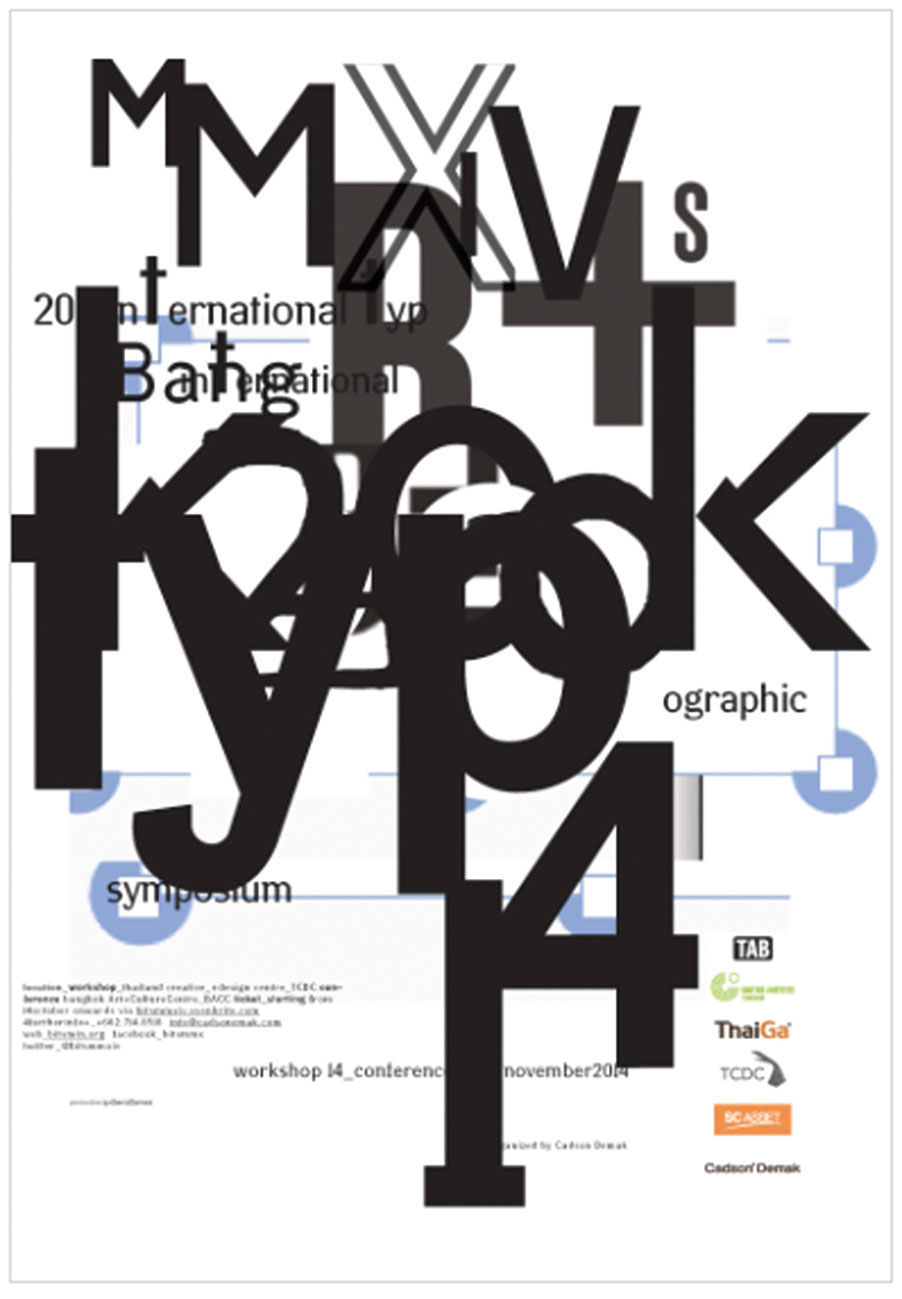
Figure 5.6: Typographic mannerism. Poster by Designer David Carson.
The visual analytics field is emerging from its own mannerist phase, characterized by irrelevant special effects and awkward design work-arounds that try to tweak and optimize obsolete solutions for new situations. While interesting and admirable, they are fussy and achieve diminishing returns on their investment. These efforts exist at the highest and lowest levels, ranging from attempts that present complex scientific visualizations to uncomprehending casual users, to ever-more elaborate efforts to legibly render titles, labels, and legends within smaller and ever-more-dynamic chart displays. Later on I will discuss some of these dead-ends in detail, why their prospects are limited, and the alternate paths forward that fully exploit the new technical capabilities.
5.0.1 References
5.1 | How Consumers Process Price Endings: A Cost of Thinking Approach (paper) | | June 1998
5.2 | Logarithmic Scale (web) | http://en.wikipedia.org/wiki/Logarithmic_scale
5.3 | Great Cathedral Mystery (web) | |http://www.pbs.org/wgbh/nova/ancient/great-cathedr...
5.4 | Jonathan Ive and the Future of Apple (web) | | The New Yorker http://www.newyorker.com/magazine/2015/02/23/shape...
5.5 | The Origins of Political Order (book) | | Farrar, Straus and Giroux
5.6 | Guns, Germs, and Steel (book) | | W. W. Norton & Company
5.7 | David Carson (web) | http://www.davidcarsondesign.com
