When you create a journey map, it can be a challenge to combine research data and the ideas of people in your organization into a map that tells an accurate, simple story. But success in this is critical. An inaccurate map could lead to bad decisions, and one that is too complex may prevent people from using it at all.
If you find yourself in this situation, consider running a perspective grid workshop to condense your data and create a strong shared understanding between stakeholders before you begin creating a journey map. In this article, we will walk through this process so that you can use it in your own projects.
When creating the IxDF course Journey Mapping: Improve the Customer Journey, we interviewed Matt Snyder about his work as Director of Product Design at Lucid Software. During our conversation, Matt mentioned how his team would use a Perspective Grid to make sure that the rest of the journey mapping process went smoothly.
“Before we ever produced the user journey map, which is the artifact of understanding, we had to create the understanding.”
— Matt Snyder, Head of Product & Design at HiveWire
We are sharing it with you because it is a simple, straightforward way to combine multiple perspectives, create a shared understanding of a customer/person’s goals and barriers, and generate ideas for removing their impediments. The method is flexible enough to include anything from quantitative data to first-hand experiences, and can be done with just a spreadsheet.
Here is Matt describing the process.
Show
Hide
video transcript
- Transcript loading…
Let’s walk through the steps for the process. At the end we will provide a template that you can download and use in your own projects.
You may have noticed that in the video Matt uses the word “customer” as the title of the first column of the perspective grid and “possible solutions” for the sixth column, so you may be wondering if the perspective grid is only useful for solution space research. We were wondering too, so as a logical test we applied the method to two Rhythm Road examples.
First, a very simple perspective grid focused on the solution space of a Rhythm Road customer who is between coaching sessions and who needs help from Rhythm Road to remember to practice.
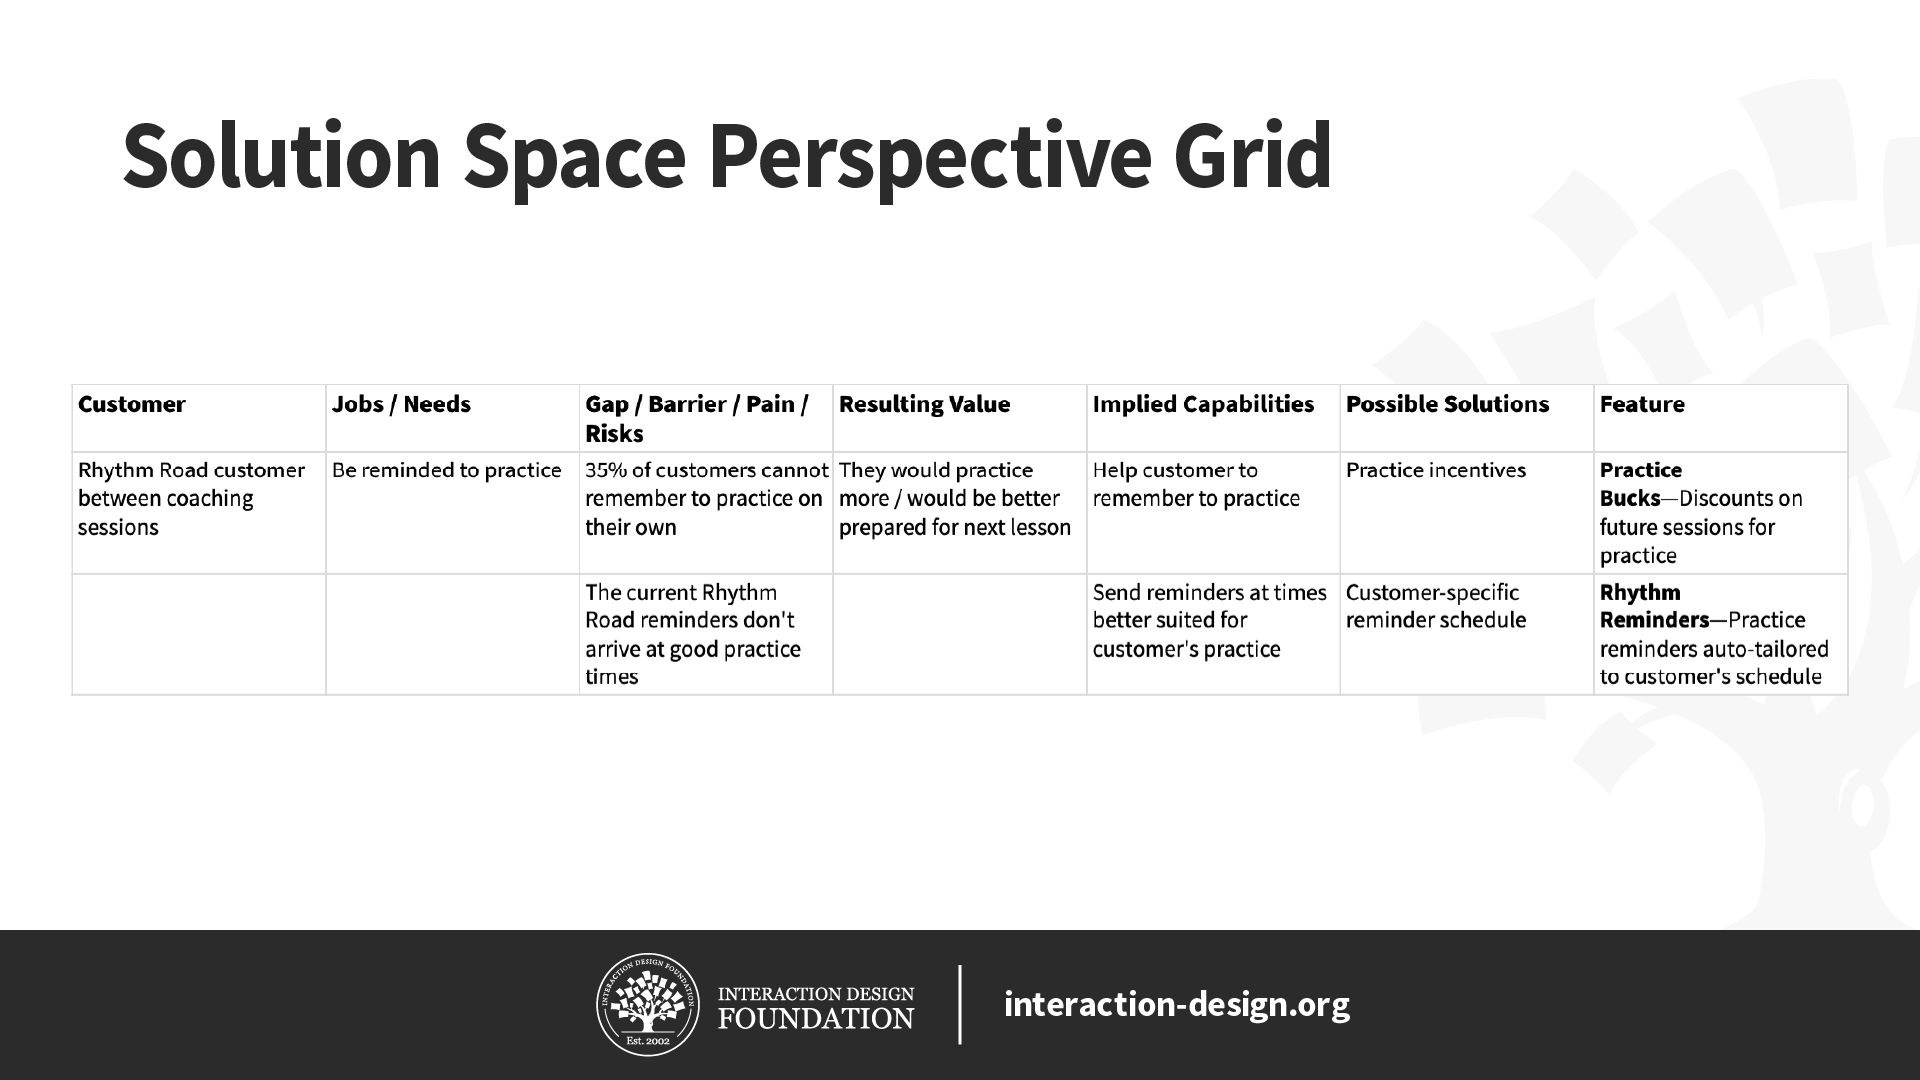
© Christian Briggs and Interaction Design Foundation, CC BY-SA 3.0
Second, a simple perspective grid focused on the problem space of a person who wants to learn to be an expert drummer, and who needs a clear path, access to drums and some instruction.
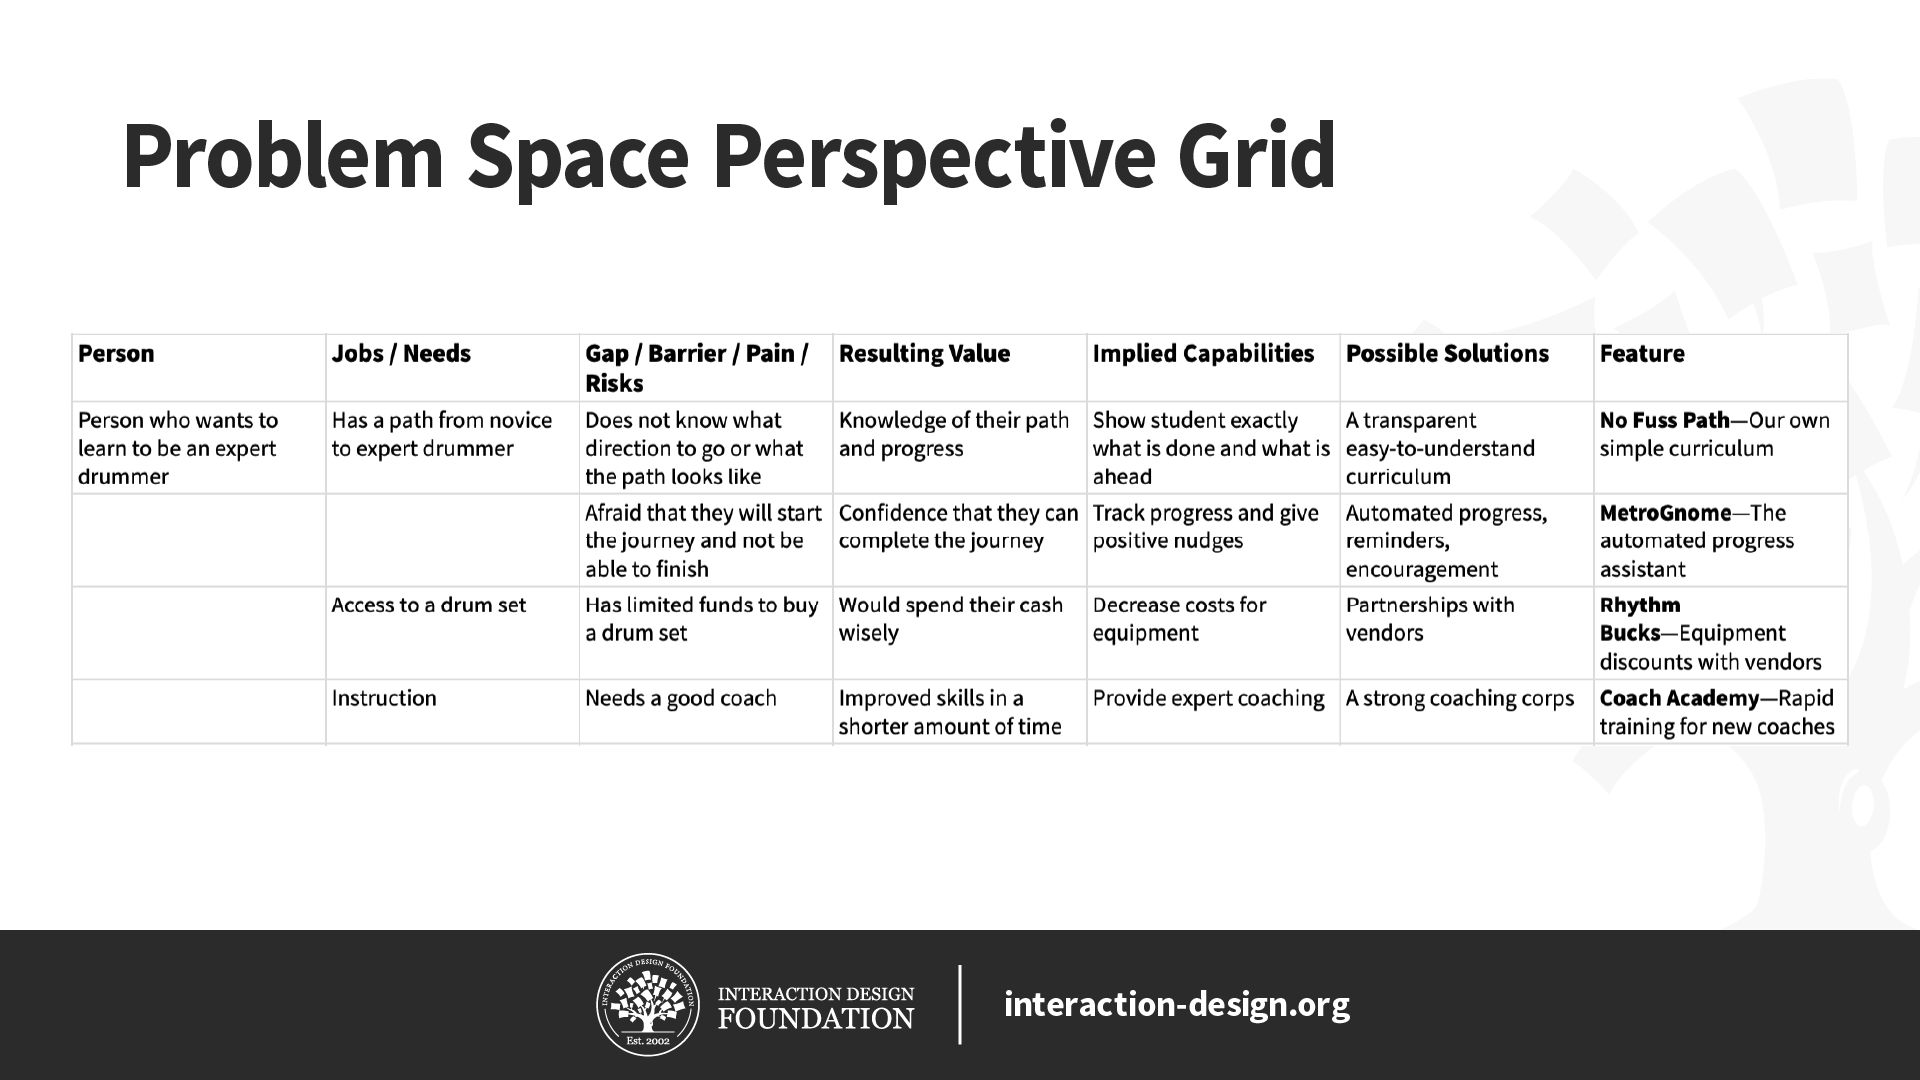
© Christian Briggs and Interaction Design Foundation, CC BY-SA 3.0
It worked! We were able to use the perspective grid in both solution and problem space research with only two changes:
We renamed the first column from “Customer” to “Person”.
We did not focus on that person as a Rhythm Road customer, even though we did come up with some capabilities, solutions and features that might be good candidates for adding to Rhythm Road.
So, as we walk through the steps of the process, keep in mind that you can apply this to either the problem or solution space.
Invite stakeholders
Your first step is to invite stakeholders to help create a perspective grid. It is important to invite people with varying perspectives on the particular person, experience or journey of interest. In the video, Matt Snyder goes as far as to suggest that a perspective grid created by a single person, or a group of people whose perspectives are too similar, is likely to be flawed.
Add the Person and Their Jobs/Needs
In the first column, add the name or title of the customer or person, and in the second column add their jobs or needs. For simplicity, you can simply think of jobs and needs as what an individual really seeks to accomplish or what they feel they need. For more information on jobs and needs, please visit the links to resources on Jobs To Be Done (JTBD) in the References and Where to Learn More section at the bottom of this page.
Gaps/Barriers/Pain/Risks
In the next step, for each of the jobs/needs in the grid, add the things that prevent the person or customer from carrying out their jobs or fulfilling their needs. These might include any of the following:
Gap: Something the person lacks. For an aspiring drummer, they might lack the ability to remember to practice, or a practice space.
Barrier: Something that is standing in the way, such as a schedule that is too confusing or rules against noise where they live.
Pain: The negative experience that prevents progress. This might be the dread of arriving to a lesson unprepared, or the frustration of forgetting.
Risk: The perceived risk, like spending too much money or failing to follow through on the goal of becoming a drummer.
Resulting Value
Next, for each gap/barrier/pain/risk that is preventing the person or customer from carrying out their jobs or fulfilling their needs, list the types of value that would be created by removing it. For example, removing the inability to remember to practice (gap) might provide the value of more practice time and being prepared for the next lesson.
Implied Capabilities
Next, for each type of value in the previous column, list the capabilities that a solution would have to have to provide that value. Remember, if you are focused on the solution space, you may want to list implied capabilities that are within the scope of what your product or service does. For a Rhythm Road customer, this might be “Send practice reminders better suited for the customer’s practice schedule.”
If you are focused on the problem space, you may want to include or focus on implied capabilities beyond your current product or service, like “Cost savings on music equipment.”
Possible Solutions
In the next column, list some solutions that could realize the implied capabilities. If you are focused on the solution space of a Rhythm Road customer, this could be anything from a slight modification of the product—like “Improve timing of practice reminders”—or something completely new, like “Financial practice Incentives.”
If you were focused on the problem space of an aspiring drummer, this could be “Music vendor discounts” or “A strong coaching corps.”
Features
In the final column, list any ideas for specific features of a product or service that could embody each solution in the previous column. If you are focused on the solution space of a Rhythm Road customer, this might be “Rhythm Reminders—Practice reminders auto-tailored to customer’s schedule”; however, if you are focused more broadly on the problem space of an aspiring drummer, a feature might be “Rhythm Bucks—Equipment discounts with vendors.”
As Matt points out in the video, you are developing pieces of a story. So, as you fill in each new column, try reading a row in the spreadsheet from left to right as a story to see if it makes sense. For example, if you read the first row of the solution space image above as a story, it should read something like this:
“A Rhythm Road customer who is between coaching sessions (customer) needs to be reminded to practice (jobs/needs) because she and 35% of others cannot remember to practice on her own (gap). If we could meet her needs, she would practice more and be better prepared for her next lesson (resulting value). To provide that value, we would need to help her remember to practice (implied capabilities), perhaps with practice incentives (possible solution) which we could call Practice Bucks that would give her discounts on future practice sessions for remembering to practice. (feature)”
Categorize
At this point the perspective grid will likely contain a lot of information. Depending on the quantity of data and how well-organized it is, you may opt to spend some time grouping, labeling and prioritizing it as a group.
For example, you might group rows that have similar or related jobs or needs or color-code the rows by a theme or by priority. The choice is yours.
The Take Away
A perspective grid is a simple, straightforward way to combine multiple perspectives and to create a shared understanding of a customer/person’s goals and barriers, and how a product or service might provide value by removing impediments. To get the full value, invite diverse stakeholders, have them fill in the columns in a way that tells stories and make sure the participants have a strong shared understanding of those stories.
Download the Perspective Grid Template and Create Your Own Now
We have provided two perspective grid templates in Excel format—the first for problem space research and the second for solution space research.


References and Where to Learn More
Read this article by Alan Klement for more on the Jobs To Be Done (JTBD) framework:
What is Jobs to be Done (JTBD)?
Images
© Interaction Design Foundation, CC BY-SA 3.0