What our customer really wants is to have the biggest and best data warehouse and BI system, bigger than that of any of their industry peers. Our role in Sales is to encourage this, and help them to justify and achieve it.
- BusinessObjects sales executive
Early in 2011, in the role of Chief Product Designer for SAP Labs, I was given the opportunity to re-think and re-design the company’s approach to visual analytics in its products. With SAP’s commitment to HTML5 for all future UX development, Analytics UX VP Michael Arent and Dan Rosenberg, the Head of UX practice at SAP, asked me to “fix our dashboard design capability” and in parallel “create a purely immersive visual analytic consumption experience”. This was an exciting and terrifying challenge due to the different approaches demanded by each request. While the former required a tactical, bottom-up effort to fix all the current stuff that was wrong, the latter called for an open-ended, exploratory design research effort.
SAP is the world’s largest provider of business application software to enterprises in every major industry. While being reliable, scalable, flexible, and powerful enough to serve as the central nervous system of any organization type, SAP products are expensive to buy and configure, complex, and provide an “industrial-style” user experience that is felt to be intimidating and frustrating. Although its business intelligence products are a bit better, having originated mainly from the 2007 acquisition of BOBJ, at the time even these were not yet suited for practical, widespread use by workers not trained as data analysts or IT professionals. Traditionally, customer IT workers serve the analytic needs of their internal customers, referred to as casual or business users. This results in a somewhat cumbersome and expensive system where the reports delivered to the decision-makers are often too late or of incorrect content. The manual back-and-forth between these internal customers and their IT service providers is costly enough to render much of the potential process value unrealized.
Because the advanced business analysts represent a relatively small percentage of potential users in an organization, the only way to bring the benefits of visual analysis cost-effectively to more people is to enable these casual business users to access and consume analytic content on their own, or with minimal assistance. As this general state of affairs is present for its non-analytic products as well, SAP’s overall strategy became driven by the goal to have its software reach, and become used daily by, one billion users worldwide. This could include users within SAP’s customer base of organizations, but would obviously require product usage by individual consumers, a market that is new and unfamiliar to SAP. At the core of this strategy was the realization that to be successful, SAP needed to drastically improve the user experience of its products, in most cases to the point of them being qualified as “self-service” enabled or of “retail quality” – meaning that users needing to complete a workflow task could operate the software themselves, without training or support, as is possible with current products used by individual consumers for personal activities.
At the end of the day, the equation that determines whether someone will use an analytic tool to help them make decisions is simple: Is the value gained by using the tool worth more than the cost of using it? If it is, and if people are aware of the tool and recognize its value, they will use it. But if the user perception is that the expense of the tool — plus the cost in time to discover, configure, learn, maintain, access, use, and evaluate it — is greater than the benefit, they will not. By definition, all current analytic tool users are those who perceive themselves to be receiving adequate benefits. The perceived value to these users is clear because their decisions involve high stakes, and are made easier by access to accurate and relevant quantitative data, to a point where the use of even cumbersome support tools is worthwhile. Investment bankers, traders, lenders, budgeters, and any other workers involved in expensive decisions – or “large-cap” workers – will consider using any tool that can help reduce the risk of a bad decision. However, for roles that make decisions of lesser business impact, or for those where quantitative data is less relevant to making a decision – the “small-cap” workers – it’s less clear whether effort spent looking at numbers is worth it.
Designer Edward Guttman encountered the definitive large-cap user during a formative user interview in support of his redesign of a Wall Street equity trading product. These users are the guys you see at a desk surrounded by five or six computer monitors. When asked about what research content the trader needed to do his job, with a straight face he replied “I need to know everything about everything”. On his desk was a big button labeled “MINE”. His job consisted of staring at a live streaming inbox of deal terms. Seemingly lifted directly from the TV game show Jeopardy!, when he saw an attractive deal come into UI focus, he hit the MINE button with his hand, to secure his rights to that deal. Andrew Murray, my long-time colleague at SAP and an inspiration for LAVA, dreams of ultra-simple software that requires only one button. This large-cap user already has it.
If we believe in the powers of free markets and aggressive sales forces, by definition all or most of those workers for whom visual analytics are a practical part of their work are already users. To expand the user base and thus the overall market, large-cap users will need more powerful / relevant product content / capabilities to justify greater consumption, and/or the cost of all analytic consumption needs to drop to where it becomes practical for use by small-cap workers. Because of the limited number of large-cap users, selling more powerful solutions to this market achieves diminishing returns. It is becoming easier to realize sales to the more fragmented but unconsciously hungry minds of small-cap workers.
The need for SAP’s visual analytic business, and in fact for SAP business in general, was to move away from their bread-and-butter of selling highly customized and expensive systems to large, wealthy companies, in favor of:
- Providing a drastically lower total cost of ownership – or TCO – and a more nimble product adoption lifecycle, leading to:
- Attracting more casual users needing less training and learning ramp-up, leading to:
- Recognized industry leadership through ubiquity of product and use, leading to:
- Enablement of a community ecosystem that provides its own viral momentum, leading to:
- SAP’s analytic consumption method as the dominant convention and even standard, leading to:
- Selling to this community the much more lucrative and higher-margin infrastructure systems and, more importantly, business data, to run the new convention and fill it with content.
A warehouse worker seeking the best place to store a shipment of pallets can rely upon their experience to make a decision, according to their knowledge of the factors involved. Or, if they have a decision support tool that is mobile, aware of the decision factors, and able to inform the worker with the warehouse’s latest operational status, this information can supplement their intuitive knowledge and enable a better decision. In the past, such tools were not available or were too expensive to justify the benefit. Now such tools are becoming commonplace, and the quantitative decision experience is enabled at a practical cost and is, in more cases, indispensable.
Because these small-cap workers have rarely had the opportunity, let alone the inclination, to use numbers in their decision-making, part of their expertise is to make informed guesses with rule-of-thumb heuristics, historical precedent, anecdotal evidence, and intuition. For those who have grown to be effective at this, their status and welfare are dependent on this accumulated experience and wisdom, and they tend to see efforts to manage by using numbers as a threat, or even an insult. In large organizations, or in highly regimented roles, most workers don’t have a choice as to what software products they use to carry out work. Such mandated products are typically mission-critical applications such as budgeting, customer relationship management, travel expense entry, and human resources management.
For mandated products, workers have very little input in evaluating and choosing the tool. In part because of the disparity between the organizational job roles of those formally responsible for choosing a widely-used enterprise software tool and those who actually use it, there is a persistent gap with such products in the understanding of what makes the tool productive and thus useful. Known as the chooser/user gap – or CUG – it appears when the motives and awareness of the tool purchaser differ from those of the tool user. Although a good chooser will do all they can to eliminate this gap, as in fact workforce productivity is the main reason for purchasing software tools, they also have a number of other conflicting factors to consider in making a good corporate purchase, such as purchase or licensing cost, preferred vendors, alliances, or other strategic factors. For mandated products that are ill-suited to user needs, workers must simply live with the related frustrations, even if the enterprise as a whole is realizing efficiencies.
The sales dynamics of products with high CUG are amazingly similar to those of toys. In the toy market, parents are the choosers and kids are the users. Parents want to provide the child with toys that they like, but that are also safe, appropriate, and affordable. As dramatically shown by Tom Hanks’ character in the movie Big, if real kids had the chance to design and market toys, the results would more closely match what kids really want. Just as toy makers need to sell to the conflicting agendas of the child as well as the parent, enterprise software vendors of mandated products need to ensure that their products meet the needs of the chooser and the user alike. Up to this point, however, selling to choosers has won out. This chapter’s opening quote emphasized the tactic of playing to the chooser’s ego – in this case, the customer’s Chief Information Officer , or CIO.
In a vivid, recent response to another product with a high CUG, design firm IDEO created a pirate-themed CT medical scanner to help put child patients at ease during the scanning procedure. The typical procedure is terrifying to kids for obvious reasons, made worse by the fact that scanners are styled to look like they belong on the Death Star. With enormous price tags, these and other complex devices are made to look sleek and powerful to boost the confidence and egos of their purchase customers, in this case hospital administrators, board members, donors, and doctors. While just a skin-level appearance treatment, IDEO’s solution appears to work. Maybe the Xcelsius Admiral theme was created for the same purpose, but rather to calm executives terrified of checking their business performance?
Mandated enterprise software tools are typically transactional – meaning that their use involves the user having read/write access to data in the tool’s underlying database. To maintain security and integrity of this data, and to simplify system administration and training, it makes sense for organizations to standardize on as few of these applications as possible.
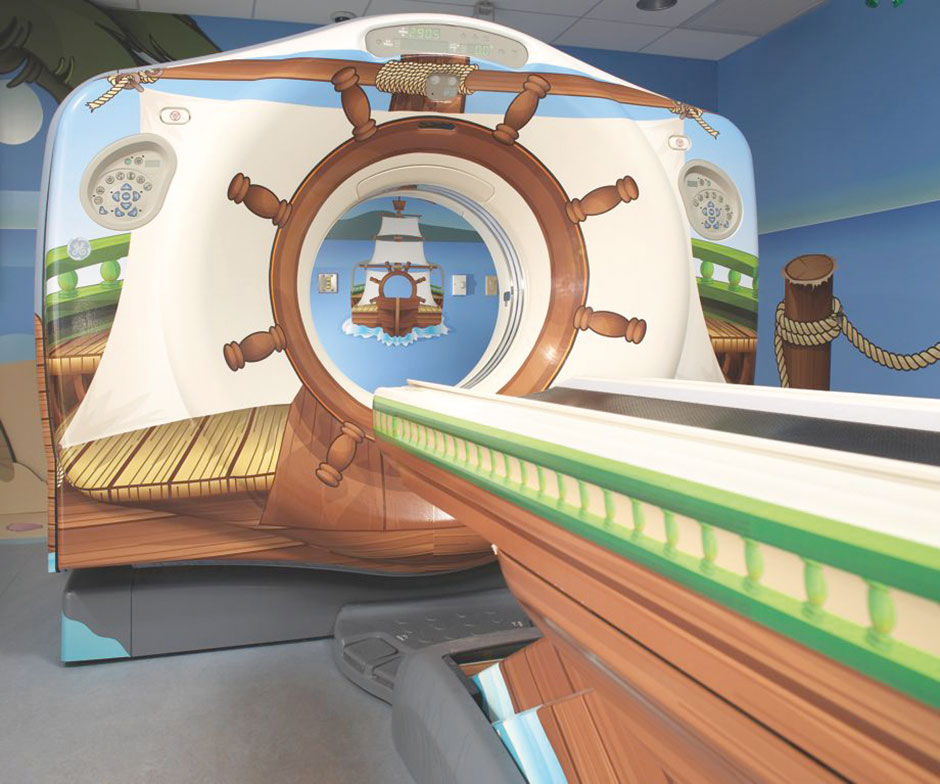
Figure 8.1: Pirate themed CT scanner by IDEO. From Creative Confidence: Unleashing the Creative Potential Within Us All, by David and Tom Kelley.
Mandated products are contrasted by discretionary products, which are those provided to users to perform tasks that may be essential to doing their work but, for whatever reason, need not be strictly governed by the parent organization. For non-transactional tools such as email, calendars, collaboration, personal backup & data storage, content authoring, or analysis, departments and individual users often have more latitude to choose tools of their own liking, even if this means incurring extra expense for them and/or the parent organization. Because in these cases the chooser is closer to the actual user – in the case of tools for personal use these two are in fact one and the same – the CUG is low and thus considerations of user needs like usability and convenience are a much bigger factor in the purchase decision. You may have heard of the “bring your own device” trend – or BYOD –for workers. This trend is BYOS – “bring your own software”.
For example, although their organization, department, or team might require or suggest standardized use of a set of authoring tools, UX designers typically can use whatever tools they prefer, provided that their output files are in a format compatible with production and/or collaborative use by others in the workgroup.
Analytic decision support tools can fall into both categories. Enterprise-level strategic reporting and performance management solutions are often centralized with mandatory tools, but if the underlying data is available in a widely-consumable format, individuals and departments can use their own tools to gain quantitative insight into their work. Such efforts are typically voluntary in that the workers are free to decide how to do their work, and use whatever resources within reason to help them do so. For quantitative research and analysis to be attractive to these workers, they need to be convinced that their effort will be rewarded with better results (and of course that better results will be rewarded with better compensation, etc. for the worker). As at the enterprise level, this is of course the equation underlying all productivity growth for any type of workplace process or accessory.
I proceeded with my work from two perspectives. The first was an a priori, top-down approach based on research I was already collecting and distilling about why and how people seek information in support of decision-making. The second was empirical, where I completed a series of internal visual analytic design consulting projects with teams throughout SAP. This series of projects, informed by the foundation research, eventually evolved into the LAVA design language.
The original research, done with colleague Geff Gilligan, was in the area of general information acquisition in the workplace, with a focus on workplace decision-making. As quantitative information is a subset of information in general, the results of this work were a great foundation for the upcoming effort. The research included sources from the field of general library science and extended decades into the past, so it was fairly technology-independent, which was perfect for the user-centered – vs. technology-centered – approach we were to take. We assembled the research into a set of general conclusions taking the form of a framework for how people go about using evidence in reaching decisions, which we then referred back to during the following two years of design effort.
The overall theme of the research results was that for data to be useful – that is to say, to become information – its applied value needs to exceed its cost of acquisition. A poor user experience for workers in acquiring information can be a weak link in the delivery chain, effectively rendering the other links useless. Without an adequate consumption experience, relevant data remains trapped, too difficult to find and apply to everyday tasks.
Information workers represent the sum of all enterprise workers using information technology in some way, and due to the expanding reach of IT, information work is finding its way into roles where it has never been used before, particularly in blue-collar jobs and in the lower echelons of the enterprise hierarchy. An ongoing industry effort has been underway to provide digital tools to satisfy information workers by making their work easier, and to create new ones by bringing information technology to roles for which it was never before practical. To clarify the ways in which they use workplace information, Information Workers can be segmented into three types:
- Dreamers do more cerebral, abstract work, e.g. developing ad campaigns, strategizing about company direction.
- Problem-solvers implement ideas generated by the dreamers and address problems or exceptions raised by people on the frontlines (i.e. “doers”).
- Doers directly add value to the product or service being offered .
In general, Problem-solvers find and create most of the information, which is then pushed to Doers, and driven by and/or pulled in by Dreamers. All can benefit from relevant decision-making information, but of course the needs of each group differ. Younger workers expect a much more digitized and virtual relationship with their work context, having been raised with such conventions in their social and educational upbringing.
Young information workers work with information differently from their forebears. They tend to:
- Use taxonomies as one categorization strategy/tool - but know that they are only a part of a total solution that includes folksonomies and folk taxonomies – which means that they are willing to accept non-traditional ways of doing things.
- Design/use information systems that recognize that different people find things in different ways.
- Have heightened sensitivity to organizational culture.
- Have high awareness of information sharing and distribution.
- Recognize that centralized control of information is an option but not the only option.
- May work in “traditional” information worker domains such as Records and Information Management but are just as likely to be found within development project teams, marketing, or human resources areas.
- Have intrinsic motivation to sharing knowledge and information.
The research does not go into the cause of these differences in younger workers, but two possible conclusions can be reached. The first is that young workers behave differently because they are young, and when they grow older they will behave as do today’s older workers. For example their tendency to share information may wane as they acquire a more cynical approach to organizational politics. The second is that their different behavior is a function of their generation and will continue into their adulthood. This is likely, given the amount and volume of information and mediated communication available to younger generations.
According to Few, people seek information to satisfy two basic needs:
To better manage what is going on now.
To better predict what will likely happen under particular conditions in the future, so we can create opportunities and prevent problems.
- Stephen Few, Show Me the Numbers
To do this, they ask questions and receive (or create) answers regarding the qualities and measures of information objects over time. They ask:
What is happening? Identifying and understanding trends. Analyzing data to establish relationships . Assessing input in order to evaluate complex or conflict ing priorities.
What has caused this to happen? Understanding cause and effect . Making connections.
What do we want to happen? Creating or modifying a strategy.
What actions would likely lead to this desired outcome? Ability to brainstorm, thinking broadly (divergent thinking). Ability to drill down, creating more focus (convergent thinking).
- Stephen Few, Show Me the Numbers
They apply these answers to accomplish, directly or indirectly, work (i.e. effort applied to a deliverable that adds value) by developing, supporting, or rejecting propositions for what the business should do. To provide better acquisition solutions, we need to understand the fundamental motivations and needs for acquisition in the workplace. Why do workers seek information? What guides and drives them? What are the different ways of looking, and how can tools better accommodate them?
8.0.1 Information Acquisition & Creation
Workers consume information for a number of reasons, such as to improve a work skill, contribute to a deliverable, gather evidence for making a decision, or just get a sense of relevant trends. At a very basic level, we can define the need to acquire information as the need to answer some form of question. This approach also lends itself to being measured and thus, in our context, is quite useful. “How many widgets did we sell last year? What is Helen’s employee number? Can I take time off in October? What forces are transforming my industry?” Although answers to some of these questions come in simple values (9,453, or i345232), others demand decisions (yes or no), or more elaborated conclusions (published analyst report). But the underlying process is the same:
- Workers make decisions to drive business forward.
- Workers ask questions to help specify uncertainties about decisions.
- Workers seek answers to these questions by collecting and consuming information .
This is not to say that each of us consciously formulates distinct questions to give form to our stream of curiosity; as individuals this process is primarily unconscious. Rather, it proposes that our curiosity can (and in many cases should) be expressed or described literally in some form of question-and-answer dialectic, and that this is a powerful basis for understanding our working relationship with information.
There are three things to do with information: Acquire it, move it, and create/delete it. Again, I refer to information in the most general sense, as Doblin did. Although acquiring information to answer questions is necessary, at the end of the day it is how workers apply information that builds business value. Creation essentially involves synthesizing existing information into new, more valuable information, in the form of skills, ideas, plans, conclusions, decisions, deliverables, and products – all essentially new information that is stored in a wide variety of forms and places. Moving information is essentially the creation of new information (in this case, new metadata for the root information’s location and history). This new information is the value that info workers add to their enterprise and to the overall economy. Information and value creation go well beyond the scope of this book, but for our purposes information workers at the most basic level create value by making decisions, for which information is in effect both the raw material and the result.
Despite their typical cynical response to the negative when asked the question specifically, workers continuously make decisions in the workplace, at the very least in regards to what they are doing and how they are doing it. Having relevant information available to help make decisions is always good, and within practical limits, having more of such information is always better, as long as its cost of acquisition and consideration does not outweigh its benefit. “Do I have enough information to make this decision?” is asked repeatedly by individuals and groups. The answer is typically “no”, but, alas, decisions are bound by time and typically contain an element of uncertainty and risk. Gathering information to inform a decision is a way to lower the risk of making a poor decision, but it always involves costs.
While workers can compete on their ability to apply the most relevant information to decisions in the least time, their most valuable ability is the skill of improvisation; the making of smart assumptions, guesses, bets, and creations when conclusive supportive evidence is lacking. Having better information to begin with serves to elevate these improvisations to a higher level, where they are more likely to result in innovations.
8.0.2 The Decision Cycle
In order to focus on the information acquisition aspect of decision-making, it helps to consider decision-making as a cycle as shown in Figure 8.2. Regardless of their complexity or importance, individual decisions pass through a cycle of conscious or unconscious steps. Work can be viewed as a stream of these decisions, interdependent and of multiple levels of complexity and importance. The cycle clarifies the elusive boundary between acquiring information and creating information.
Regarding the diagram, although we can imagine a worker entering the cycle at any point, we can realistically trace any curiosity back to the need to make some sort of decision regarding something, however vague or remote. Assuming a worker does face a discrete decision, they will ask themselves if they have sufficient information to make the decision in the given context. If the answer is “no”, they seek new information to apply to the decision. The requirement for this task is captured in the form of a question – which is itself new information. They then gather information from one or more sources, ranging from their personal memory to databases, documents, Websites, colleagues, whatever. At some point they collect their findings and begin to consume them.
As already mentioned, acquisition is worthless unless applied to work in the form of a deliverable that adds value reached through decisions. Asking questions, synthesizing information into propositions, and making decisions all involve creating new information. This new information is how workers innovate and create value, so to understand acquisition we must understand its contribution to creation.
Of course this process often happens iteratively or fluidly, and the line between gathering information and consuming can be unclear. Workers can gather a pile of information objects and then consume them sequentially in detail, or consume objects piecemeal and in varying depths as they are gathered, or do a mix of both. It is also unclear what constitutes an “Information Object”. What separates one object from another? At what point does the gathering of an object become the consumption of the object? For traditional objects, such as books, articles, documents, Web pages, or business objects like employees or products, object boundaries are fairly clear. For other forms, such as structured data sets, business processes, discussion threads, and blogs, the object boundaries are less clear or nonexistent. For these latter forms, it might be hard to imagine their being distinctly “gathered” and “consumed”.
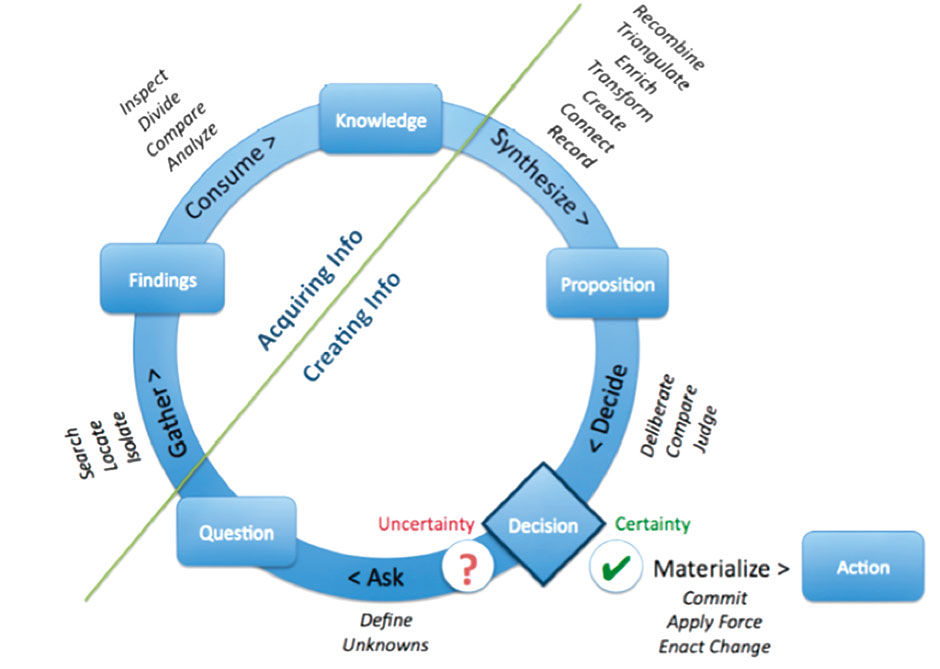
Figure 8.2: Information acquisition in the decision cycle.
Similarly, it can also be difficult to distinguish the search for objects from the search within objects. One example of this is how Web pages can allow their most useful content to be revealed, formatted clearly, in search engine results. An example of this is searching Google for an airline flight number. Instead of offering truncated or sample content from the page of the Web page of, or containing, that particular flight, as its top hit, Google first displays a concise status in “card” format of the current instance of the particular flight. In fact the search result set becomes almost an information object unto itself, essentially metadata combined and turned into master data within the context of the search result. Their card format now also shows structured summaries of other common information entities as well.
Despite these somewhat undefined and drifting boundaries, the steps of gathering and inspecting are still fundamentally valid, and remain useful to understanding information acquisition. Having located and defined the acquisition activity within the overall decision cycle, and determined that information needs can be stated as questions, we can analyze the types of questions users ask, and what contextual factors determine their form.
8.0.3 Types of Questions
If making good decisions is a worker’s main goal, and if questions specify the decision’s information requirements, then understanding workers’ questions is key to providing them with good answers. Business questions can be classified according to scale or “level”, an attribute that is roughly a combination of a question’s complexity and importance. Several prominent academic researchers have converged on this or similar variables as the most meaningful way to analyze acquisition requirements. Note that complexity and importance are not identical – for example, “dial 911 for emergencies” is a simple answer to a very important question – but in general the important business questions seek to resolve complex issues. This diagram relates question level with the questioner’s certainty about where and how to seek answers, and also about what form the answer will take.
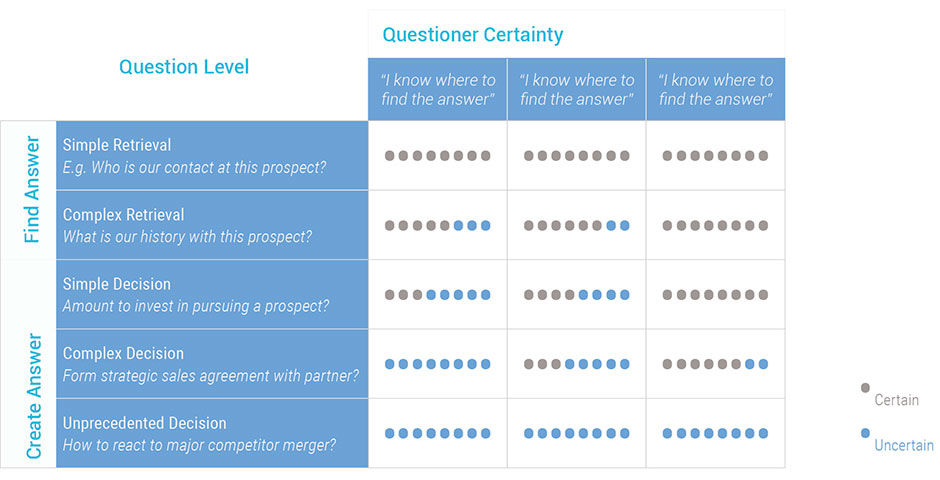
Figure 8.3: Levels of workplace questions.
In the Simple Retrieval example, the answer will be a person’s name, and the questioner knows that beforehand. The answer to the unprecedented decision could range from ”nothing” to a revised long-term strategy. Higher-level questions are more common for Dreamers, lower-level questions for Doers, with Problem-Solvers facing a mixture. Research shows that acquisition behavior changes with decision level. Workers faced with higher-level questions typically seek information from more sources, in particular more external sources, general-purpose sources, and interpersonal sources – or personal networks.
For the foreseeable future, executives will not receive good answers by typing Unprecedented Decision questions into WolframAlpha’s answer tool – or use Magic 8-Balls or mystics for that matter – although they may try. In reality, higher-level questions often get answered by being reduced to lower-level questions, whose answers, provided more by existing information, are then synthesized by individuals and groups – into new information – to create answers to the higher-level questions. Having established an overall model for why workers acquire information, let’s now turn to examine workplace questions, which are in effect the ways workers acquire information.
8.0.4 Acquisition Behavior
The four general acquisition behavior modes, adapted from several academic studies, represent the fundamental ways that workers approach information acquisition. It defines four modes by crossing the dimension of user certainty with that of user imperative. Certainty is a measure of the worker’s certainty about what they seek, how they will seek it, and the form of the associated answer, and is further detailed in the next section. Imperative is a combination of the worker’s retrieval timeframe, motivation, and urgency. Each mode places unique demands upon any acquisition solution, and requirements should clearly reference which mode(s) are being addressed by a given acquisition solution.
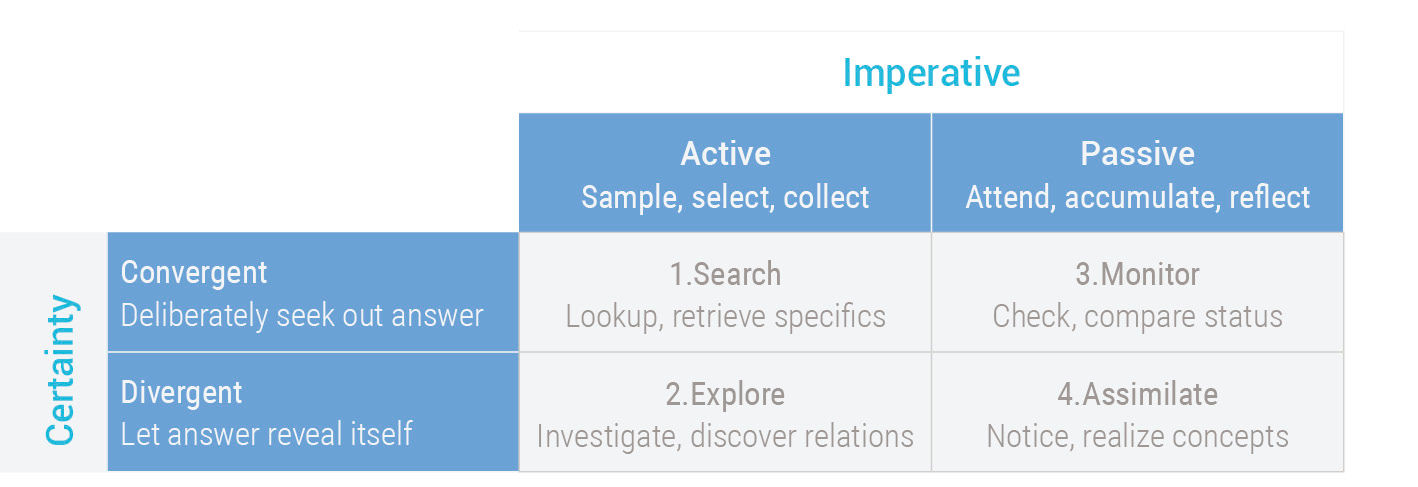
Figure 8.4: Work modes for information acquisition.
Although workers do use these modes in their purest form, they regularly shift modes within a task in response to context changes. In fact, this is perhaps the most important user behavior to keep in mind when designing acquisition solutions; carrying out of the acquisition task often alters the original goal of the task itself. Workers reflect on their ongoing progress and iteratively feed the results back, to re-evaluate their goals and acquisition approach. Although workers combine and change modes to suit their unique needs and contexts, these modes are the basic ingredients of the acquisition experience.
Assimilate is the most difficult mode to imagine addressing with specific affordances. Assimilation approaches of individuals are highly personal and varied, and can best be supported by providing ad hoc, recurring access to a variety of relevant and stimulating content resources.
Monitor is better understood. Performance management solutions offer metrics to track business status via personalized dashboards, alerts, news feeds, and social connectivity tools enable users to track status and events as they unfold.
Search is also fairly well understood, as long as its definition is limited to directed behavior, where the user is relatively certain of the where, how, and what of seeking their answers. Defining search in this somewhat limited way allows us to isolate and elaborate the more expansive Explore mode.
Explore, now often referred to as Exploratory Search, refers to the common but relatively unarticulated approach to acquisition where workers know they need information but are not sure how to define it. “I’ll know it when I see it” is a common description of the uncertainty associated with this mode and its reliance on what is called target recognition (seeing what you want) versus target specification (asking for what you want). This is called the Identification Distinction, and is discussed in detail below. Perhaps more revealing to understanding the Explore mode is the greater user sensitivity to the context of the explored objects, as opposed to their contents. The seeking of patterns and orientation cues is normal for those exploring unfamiliar spaces, and is relevant for more than just navigational purposes. Both among and within info objects, explorers seek to understand contextual patterns of meaning, such as parent and child categories, trends, relationships, and causalities, as a way to understand the essence of a subject without consuming its objects in detail. This is captured by the Source Type dimension, and is also discussed in more detail below.
Because information workers need to go beyond existing facts and options to discover unarticulated problems and opportunities, exploring is particularly relevant in the business context. However, it is also the least supported, as it is difficult for solution designers to anticipate the myriad of Information Worker contexts, and enable solutions that can support each of them.
Workers explore to collect, inspect, review, and compare information that was previously unknown to them. This includes collecting multiple perspectives within single objects, and sets of similar or dissimilar object types. Over time, discoveries accumulate and are assimilated into net-new knowledge. The results of this process are commonly referred to as insights. Insights constitute the creation of new information, and can be a dramatic source of competitive advantage for the enterprise. An individual might express an insight by saying “Having analyzed store performance metrics for the last ten years, I have concluded that monthly year-to-year sales is the best indicator of store health”. This knowledge acquisition belongs within the Assimilate mode because it answers a question that was not explicitly articulated beforehand, and it occurred gradually over a relatively long time period.
Although information acquired from all modes can contribute to insight, it is typically the result of information found while exploring. Because, by definition, exploring involves unfamiliar information, it is more likely than the other modes to yield new knowledge that triggers a breakthrough realization. However, Explore’s benefit is diluted by its relatively high, or “noisier”, signal-to-noise ratio. By definition, uncertain workers will necessarily waste time pursuing irrelevant things. Any acquisition solution that intends to improve worker productivity will need to provide a better value-to-waste ratio. A major challenge in doing this is measuring the implicit, yet undeniable ambient benefits of exploring-based acquisition, especially when those benefits result in assimilated insights.
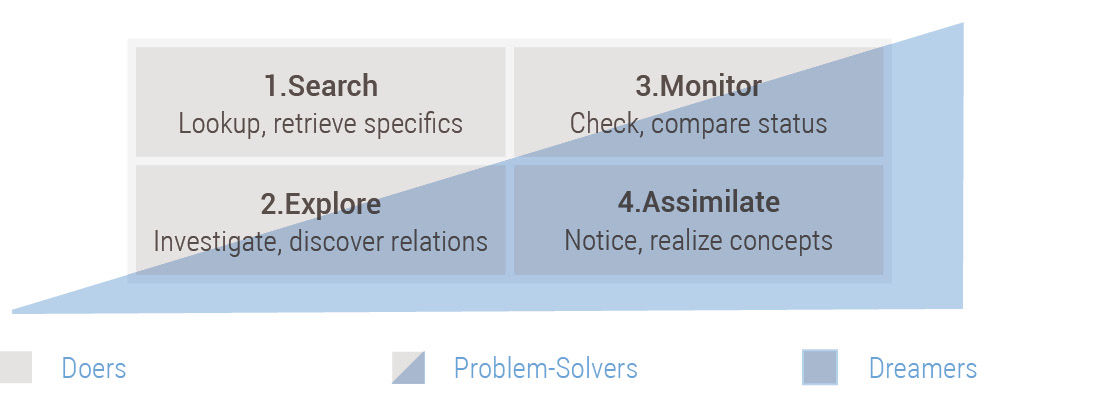
Figure 8.5: Acquisition modes and worker types.
From this point forward, I will pivot around the Explore mode. This is the target of most recent industry design innovation, and while its design challenges can be significant, exploring is the interaction behavior with the most opportunity for successful product innovation. I’ll focus on Search and Assimilate in relation to the Problem-Solver worker type, as the needs of these workers span all four acquisition modes. Note that Figure 8.5 doesn’t claim that Doers do not assimilate and Dreamers do not search – all worker types exhibit all modes – it rather indicates the general pattern of these modes as they relate to targeted acquisition related to formal job responsibilities.
8.0.5 Specific Acquisition Behavior Modes
As stated already, the main question attributes that determine how a worker will proceed to answer their question are Certainty and Imperative, which when combined create the four behavior modes of Search, Explore, Monitor, and Assimilate. To analyze acquisition behavior in more detail, the next two relevant attributes are Identification – how the worker identifies and chooses information targets – and Source Type – whether the worker identifies master data or meta data. This results in the sixteen unique acquisition modes of Figure 8.7.
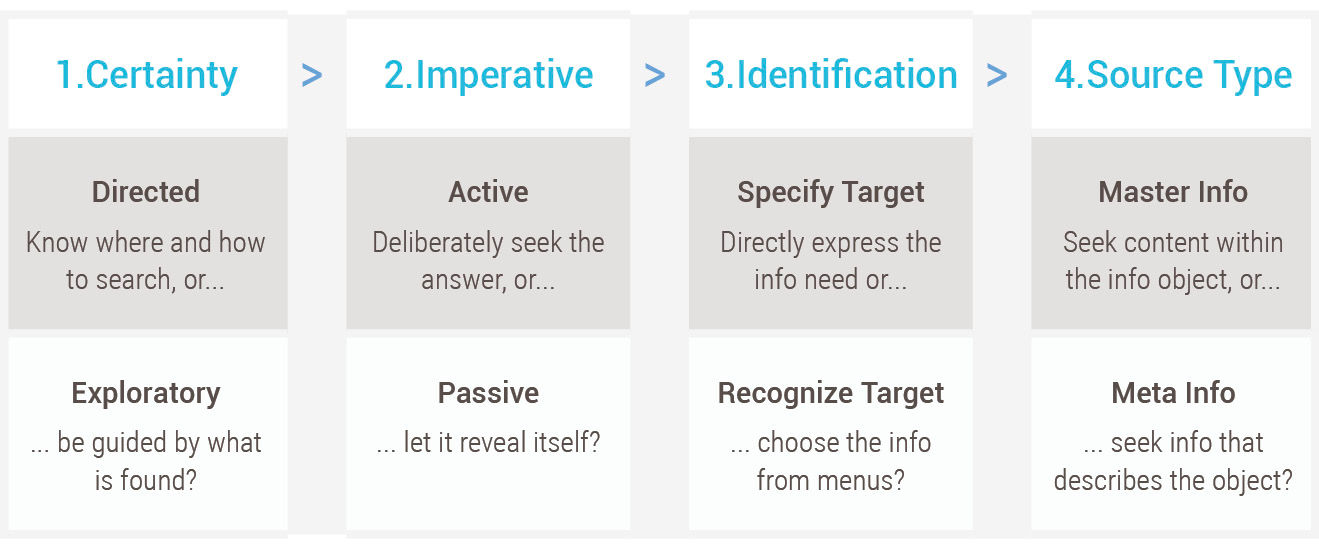
Figure 8.6: Acquisition micro-mode model.
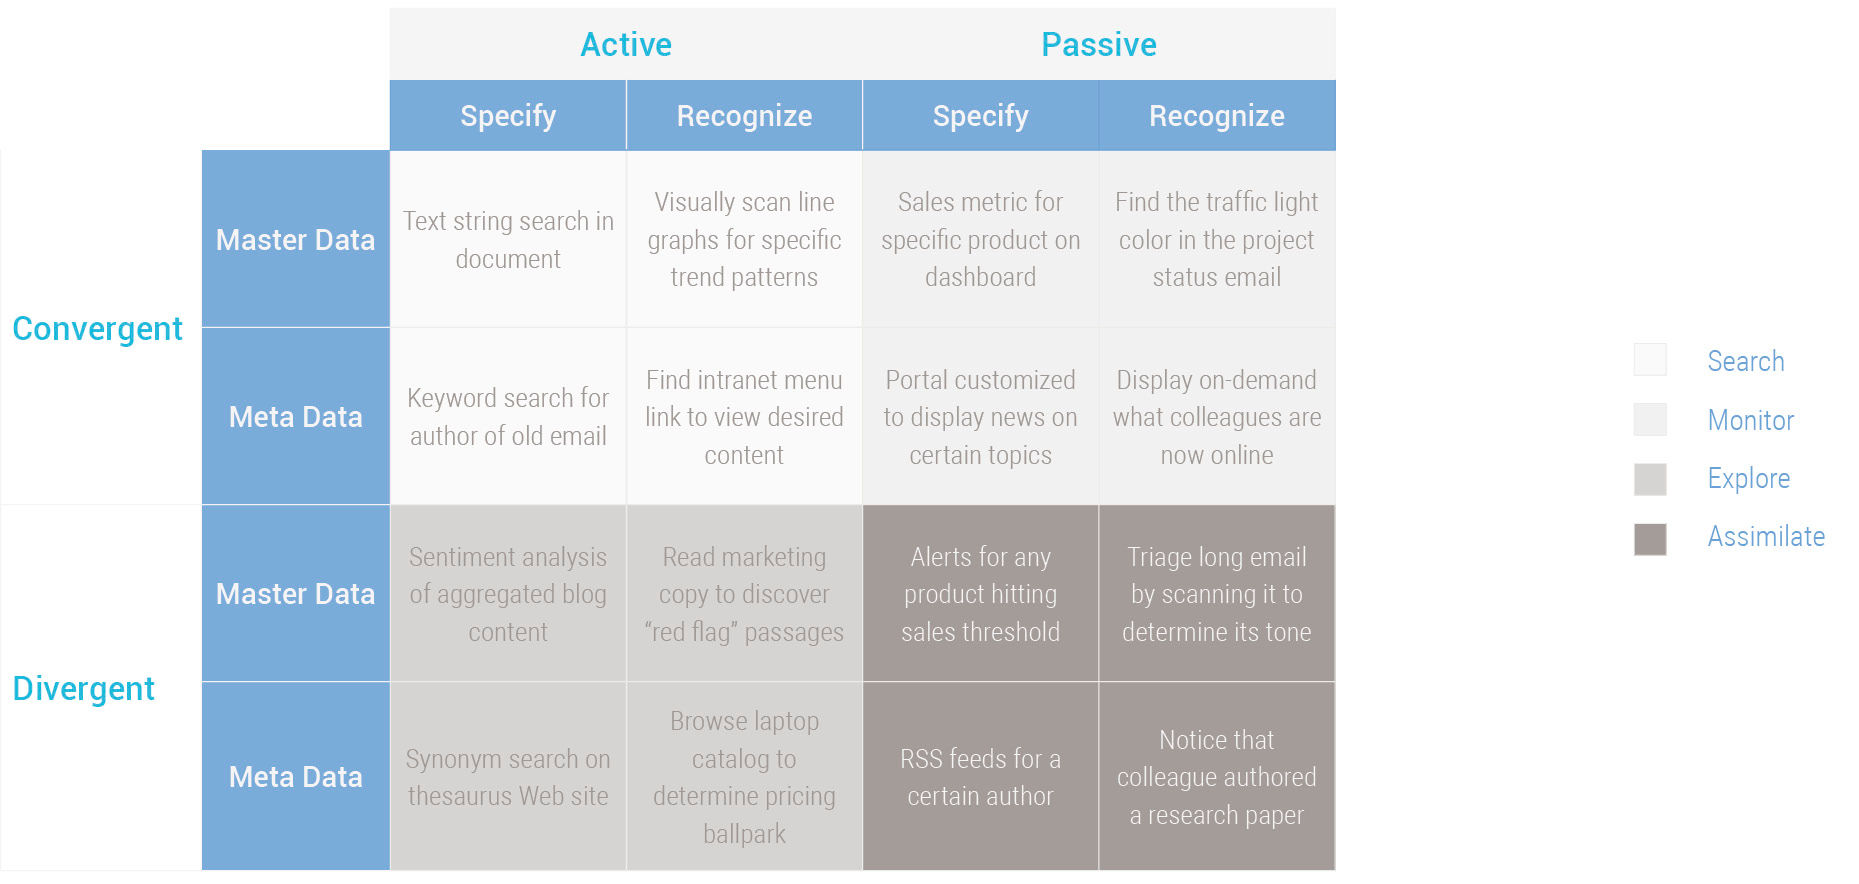
Figure 8.7: Acquisition micro-modes.
The distinction between Specify and Recognize represents the Identification dimension, and is explained by the “I’ll know it when I see it” phenomenon. If we are not sure of what we want, we can look for help by sampling the options available to us. Maybe we will stumble upon something that fits our needs, or perhaps the act of viewing the options at hand helps us to further define our needs, and proceed to seek them more directly.
The distinction between Master Data and Meta Data represents the Source Type dimension, and is defined by whether the user is searching for information within an object (master) or information about an object (meta). This distinction is not always clear, but the spirit of this distinction is that if a user is not confident enough to commit to a master data inquiry, they can instead sample metadata as an indicator of what resides in the details. For example, knowing the date and author of a report could qualify or disqualify its relevance without having to read it . In e-commerce, product specs are master info, product comments are meta info.
This matrix of acquisition behaviors is useful for seeing the range of cases, in particular as they change from the relatively pure examples at the corners – such as [Directed > Active > Specify > Master Data], or [Exploratory > Passive > Meta Data > Recognize]. It also forces us to consider some hybrid or seemingly contradictory examples – such as [Exploratory > Active > Specify > Master Data] and thus perhaps causes us to consider a wider variety of activities as belonging to the category of information acquisition.
8.0.6 An Illustrative Scenario
This usage scenario depicts how a typical information worker, in this case a sales representative, Maya Count, acquires information to help her make a workplace decision. It describes how Maya would go about accomplishing an information worker task, and references some tools she might use. Keep in mind that, for clarity, the tools referenced in the scenario represent neither the state-of-the-art nor intentionally primitive solutions. Rather, they intend to represent what is widely available in most large enterprises today.
Maya Count is a representative who sells a line of major-brand office equipment systems to large business customers. One of her major responsibilities is to optimize the efficiency of her efforts, primarily by expending effort on prospects most likely to purchase the most products with high satisfaction – which can be thought of in the form of a question “on which prospects should I concentrate my efforts?” To support her effort to prioritize his resources, she acquires information of multiple sources and forms.
Her process of scoring a prospect begins when she receives a list of prospects — customer leads that are interested in the company’s products — from the marketing organization. She collects all incoming leads into a queue, and every Monday reviews them to decide which to pursue, and how aggressively.
The goal of his effort is to answer the question “how much should I invest in trying to sell to this prospect?” In this business context, the question falls into the category of a Simple Decision. Maya is thus…..
- Relatively unsure where she may find her answer
- A bit more confident about how to find the answer, and
- Aware of the form, if not the content, of the answer (an approximate number of hours and amount of expenses for travel, research, entertainment, support, etc.)
She has a limited quantity of time and budget to spread across all prospects, so in fact the answer to this question is a part of the bigger question of how to spend all of her resources on all prospects. Her first step in assessing the effort level might be to talk to the prospect’s contact person, to perhaps get an intuitive feel for their interest level. To do this, she needs an answer to the question “what is the phone number of our contact at Acme Inc.?” (Question 1) For the answer, she decides to look up their contact information, and begins by navigating to her CRM application from her Outlook Calendar. There, she types the name of the prospect enterprise, Hakme Inc., into the application’s global search box, along with the word “contact”. The search results display a list of business objects sorted by relevance. One entity in the list is labeled “Hakme Inc. Office Printers” and is of the object type “Prospect”. Maya opens this object and in the first display screen she finds the name and phone number of the contact. She creates a link to this prospect and adds it to a personal container in her application called “My Prospects” and proceeds to call the contact. This is an example of Search, and is among the simplest types of acquisition. Maya actively sought out, and directly specified, her desired master data target.
Later, after gathering contact information and talking with several prospects, Maya has narrowed her prospect list to those most likely to buy from her in the current sales cycle. Maya’s second step is to prioritize the list to favor those prospects that have a good track record with her company, and tend to buy large quantities of office equipment and additional service contracts. This forms the basis for her second question, “what is our sales history with these prospects?” (Question 2) To determine this, Maya needs information about the historical interactions between her company and the prospects. She knows relatively well where and how to find the answer, and knows what form the answer will take. Referring to his short list of prospects, Maya navigates to the sales records for each prospect in the company CRM system. She may review the record of each prospect independently, or perhaps compile the individual records into a folder or report for detailed analysis.
She finds that of the eight leads she is targeting, five have previously bought from her company, and one of them proved to have trouble with on-time payments. She completes her decision task by ranking the prospects and proposing for herself how many hours she will target for each prospect this month. Maya’s actions show how she is breaking down her principle high-level question “on which prospects should I concentrate my efforts?” (Question 3) into low-level questions that can be easily handled by the acquisition tools she has at hand. The result is that Maya has created the answer for her simple decision question.
8.0.7 In Review:
- Information work involves acquiring, moving, and creating information.
- Information acquisition exists to support workplace decision cycles.
- Decision cycles are a stream of explicit or implicit question-and-answer activity that creates value and builds knowledge. Knowledge applied over time leads to wisdom.
- Question complexity is the most relevant variable in determining acquisition behavior.
- Workers acquire information within four intent-based behavioral modes: Searching, exploring, monitoring, and assimilating.
- Workers can specify their acquisition target beforehand, or recognize it once they see it.
- Workers can search metadata about objects, or master data within the objects themselves, but this distinction is growing unclear.
- Data is raw facts, information is data prepared and delivered, knowledge is information consumed and recalled, intelligence is knowledge applied and extended to new cases, and wisdom is intelligence applied over time to determine right from wrong.
While this may be all interesting from an academic perspective, how can we apply it to the design of a real product? What are the insights to be taken from this instance of acquisition that are relevant to visual analytic design innovation?
The first benefit of this research is its presentation of the breadth of use cases, structured and mapped to personas and situations. It’s a checklist and reference for all the ways we look for stuff. We acquire information in a variety of ways, and how and where we find useful information can be unpredictable. How do we encourage serendipity in a seemingly routine or regimented activity?
The second is the confirmation that in goal-directed situations, people don’t seek information for fun or distraction, but rather to improve their decisions within constrained time frames. None of the research emphasized the role of sexiness or being stunned in the process, but rather reveals a quite sophisticated activity of cost/benefit analysis in finding what we want. Third, information acquisition is only part of a larger decision cycle that is social and creative. How can BI products prompt users to ask new questions and synthesize answers, as well as to gather and consume answers?
Finally, the most useful guidance from the research lies in the quadrant of Active/Passive and Convergent/Divergent behaviors, with the resulting modes of Search, Monitor, Explore, and Assimilate, and the finding that users switch modes within sessions depending on the stream of acquisition results. Current BI experiences tend to specialize in either Search, Monitor, or Explore, thus separating the underlying data into different locations and protocols. This minimizes the facile transfer of behavior between modes, and contributes to the neglect of the elusive and unpredictable Assimilate mode. Could we segregate and present data according to its subject and relevance to real issues, versus according to how the tools enable it to be accessed and navigated? It seems that any broadly-used product would need to enable more of these modal behaviors, albeit in more constrained or initially simpler ways, within a single experience. This is what we set out to accomplish when we began our design work.
8.0.8 References
8.1 | Creative Confidence: Unleashing the Creative Potential Within Us All (book) | | Crown Business
8.2 | The Information Workplace Will Redefine The World Of Work – At Last! (report) | | Forrester Research, 2005
8.4 | Wolphram Alpha (web) | http://www.wolframalpha.com
8.5 | Navigation: The Process of Asking Questions (article) | | American Documentation, October 1962
8.6 | A New Model of Information Behaviour based on the Search Situation Transition Schema (article) | | Information Research, Vol. 10 No. 1, October 2004
8.7 | Evaluating Advanced Search Interfaces using Established Information-Seeking Models Schema (article) | | Journal of the American Society for Information Science and Technology, 2009
8.8 | Understanding and Supporting Multiple Information Seeking Behaviors in a Single Interface Framework (slide presentation) | | Rutgers University
8.9 | On User Studies and Information Needs (article) | | Journal of Documentation, v37 n1 p3-15 Mar 1981
8.10 | Context in Enterprise Search and Delivery (article) |
8.11 | A Longitudinal Study of Exploratory and Keyword Search (paper) | | Proceeding JCDL ‘08 Proceedings of the 8th ACM/IEEE-CS joint conference on Digital libraries, 2008
8.12 | The High Cost of not Finding Information: An IDC Whitepaper (paper) | | www.idc.com
8.13 | Innovation and Evaluation of Information: A CHI98 Workshop (paper) | | SIGCHI Bulletin, Volume 31, Number 1, January 1999
8.14 | Information Search Tactics (article) | | Journal of the American Society for Information Science, v. 30, July 1979, P. 205-214
8.15 | IToward an Integrated Model of Information Seeking and Searching (presentation) | | Keynote, The Fourth International Conference on Information Needs, Seeking and Use in Different Contexts, Lisbon, Portugal, September 11-12, 2002
8.16 | On Conceptual Models for Information Seeking and Retrieval Research (article) | | Information Research, Vol. 9 No. 1, October 2003
8.17 | Information Seeking on the Web: An Integrated Model of Browsing and Searching (article) | | First Monday, Volume 5, Number 2, February 7 2000
