Customer BI systems should be modular and easy to build and expand, like Legos.
- Stéphane Le Cam, VP Engineering, SAP
In this chapter I describe the structure of LAVA’s organization and summarize its components. In the following chapter I will describe each component in more detail according to their function and interaction behaviors.
The most iconic element of the LAVA design language is the Board. Derived from the term Dashboard, a Board is a dashboard-like space for displaying visual analytic content, and like dashboards is intended for the information acquisition modes of monitoring and simple analysis. The intent in giving this object a distinct name is to highlight several basic differences between it and the traditional dashboard form type. We see the Board as the basic unit for viewing a corresponding individual Data Set. Although data sets are becoming more fluid, now often the result of dynamic blends of data coming from multiple sources, the Board is intended to be the final consumption destination for whatever unit is defined at the end of the provisioning process. Boards provide the appropriate scale, preview and exploration properties to understand and get value from self-contained data sets.
Rather than requiring an artisanally created and maintained digital space, Boards use layout templates, called Composites, which enable the optimum analytic consumption experience for the widest variety of use cases. Think of Boards as empty containers into which raw analytic data can be “poured”, and automatically displayed. With Boards, little or no composition effort is necessary in order to quickly reach a usable consumption experience. The intent is to enable properly-provisioned data sets to be opened and appear, rendered in Board format, automatically. Given this, Boards are also intended to be a living form, configurable and editable within simple constraints by individuals and groups of users, without needing expert design or technical assistance.
In many ways the antithesis of the traditional dashboard metaphor, Boards are merely a vehicle for enabling individual and shared exchange of quantitative data. They have the most useful functions for doing so, pre-configured for easy learning and use. Most dashboards are designed for a limited audience of typically specialized workers, who are familiar with quantitative work. Dashboards intended for wider audiences typically fail because it’s still too hard to make them understandable and relevant at these scales. You can think of Boards as sort of a universal player for analytic content, intended to be supremely easy to understand and use by a far wider audience than traditional dashboards.
In the following static examples, and in general, I use the tablet format as it represents the “middle ground” in the range of device screen sizes intended for LAVA deployment and consumption. Designs targeted to this form factor can readily scale up to browsers and down to handsets, not to mention the adaptation to the ever-more gradual continuum of display sizes, from augmented-reality glasses to jumbotrons. (In reading this description of Boards and the other components, you might want to revisit the animated demos for further clarification). In the case of Board Composites, I use a single default example – the Board archetype – for most demonstrations. Although the components can be re-arranged into other templates or custom designs, the intent is that a few basic layouts accommodate most usage, and the constrained behaviors of the components will allow the behavior of different Board layouts to be consistent and intuitive.
Because Boards are simple, standardized, and general-purpose, they can be combined into multi-board analytical environments called Board Sets. Using Boards as components, Board Sets are a way to maintain the “pedestrian street scale” of Boards while allowing collections to grow and scale into “skyscrapers,” without breaking or needing re-design.
Because Boards in a Board Set all appear and operate in similar ways, and behave similarly on any device, any user who learns how to use one Board will essentially know how to use all others in the set, and in any other set, on any device.
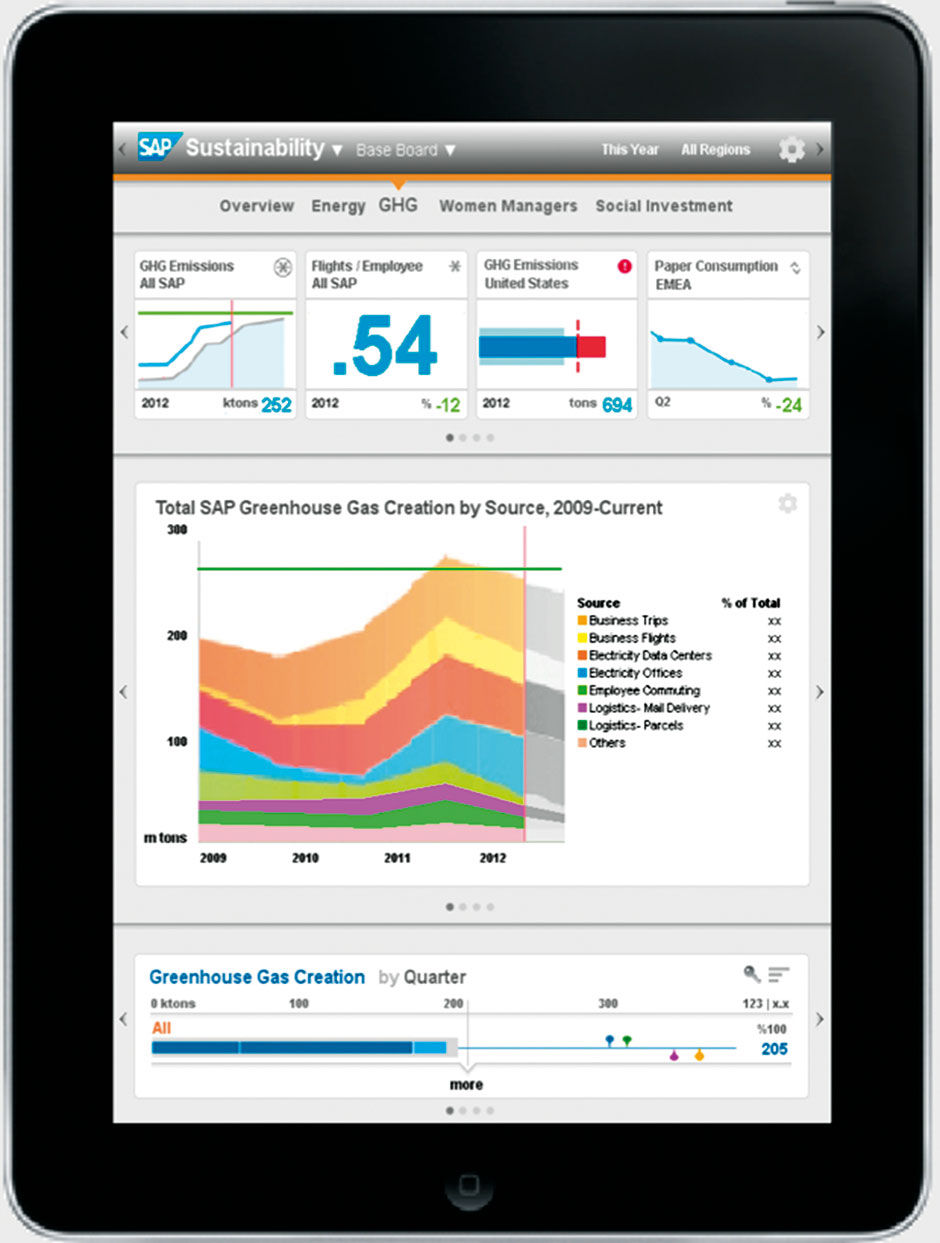
Figure 13.1: Board for enterprise sustainability data.
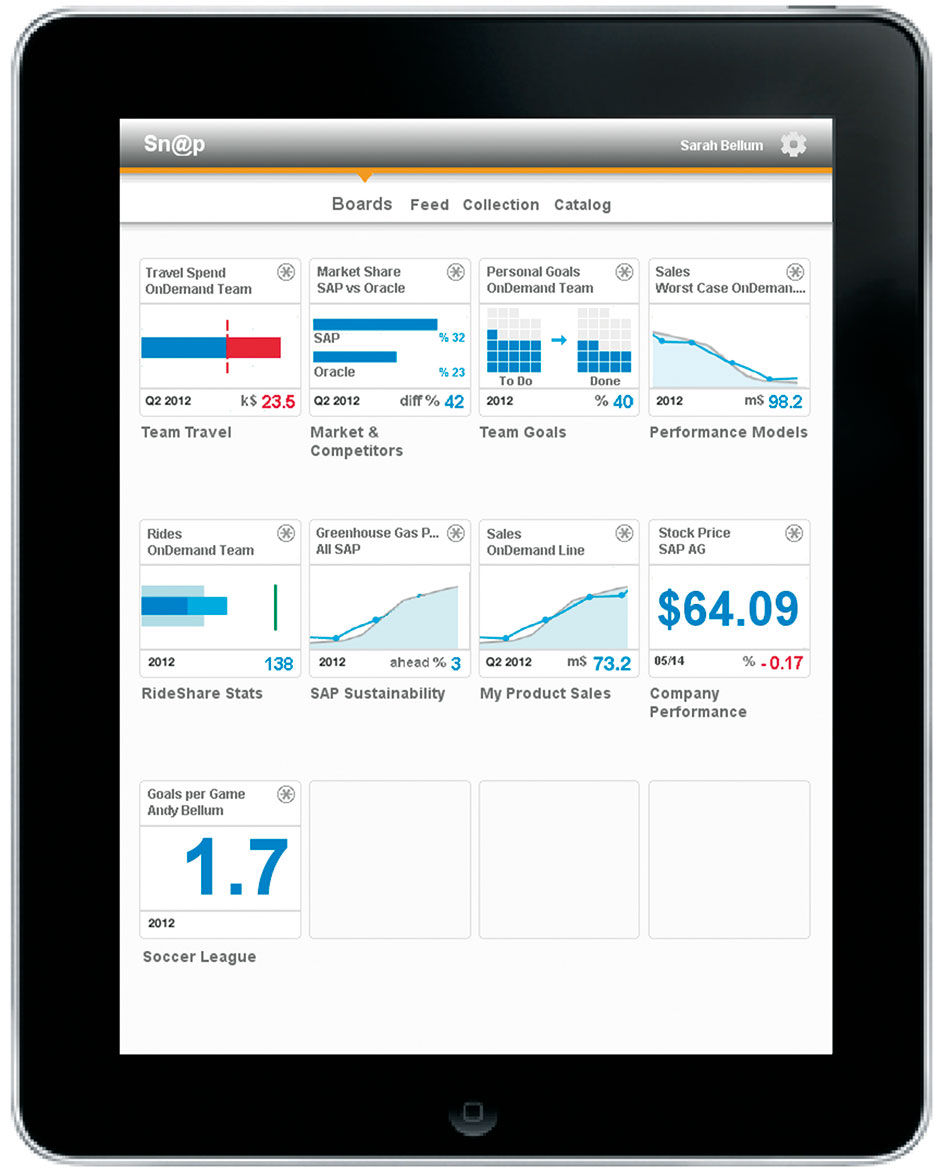
Figure 13.2: Board Set with hypothetical content for an SAP Manager.
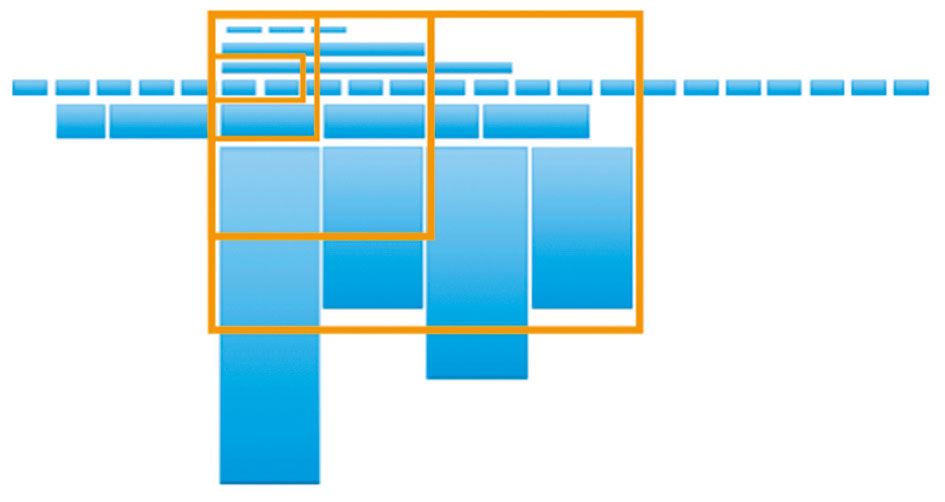
Figure 13.3: The Board Landscape
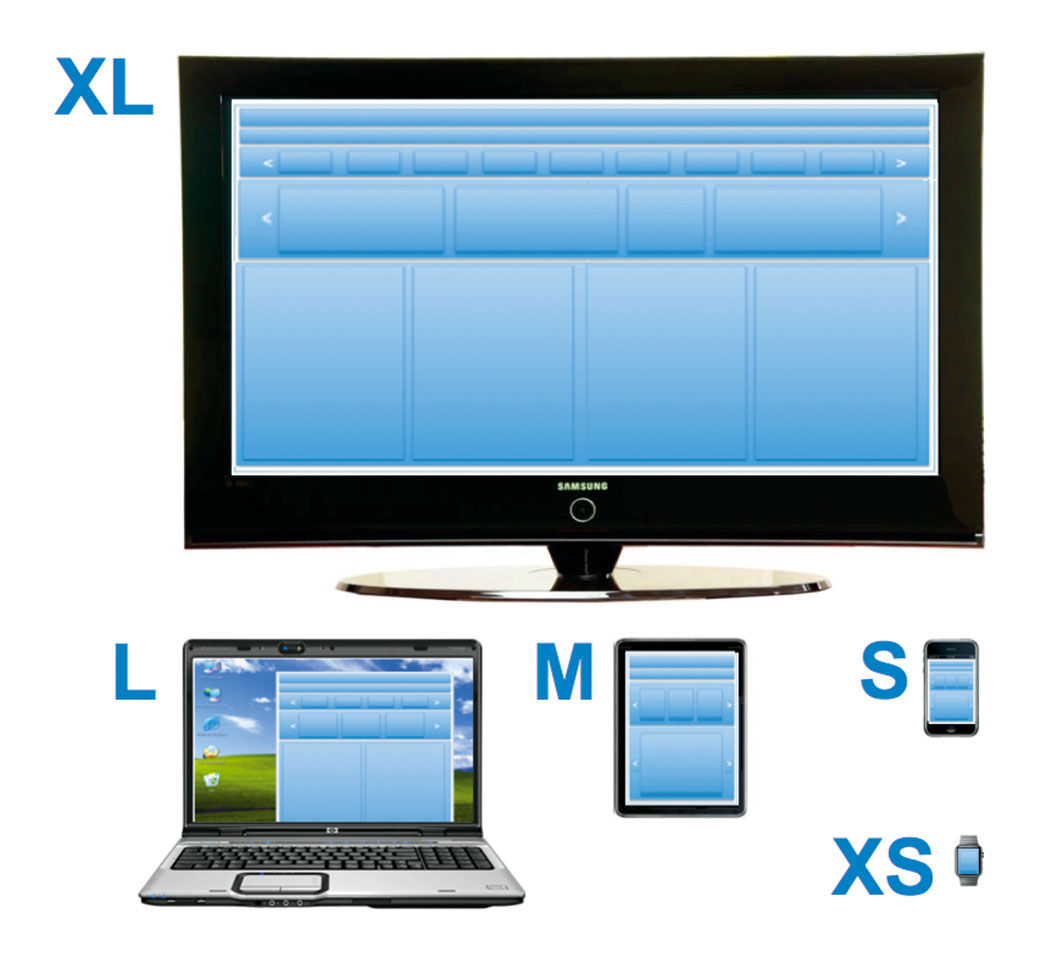
Figure 13.4: Cross-device layout continuity.
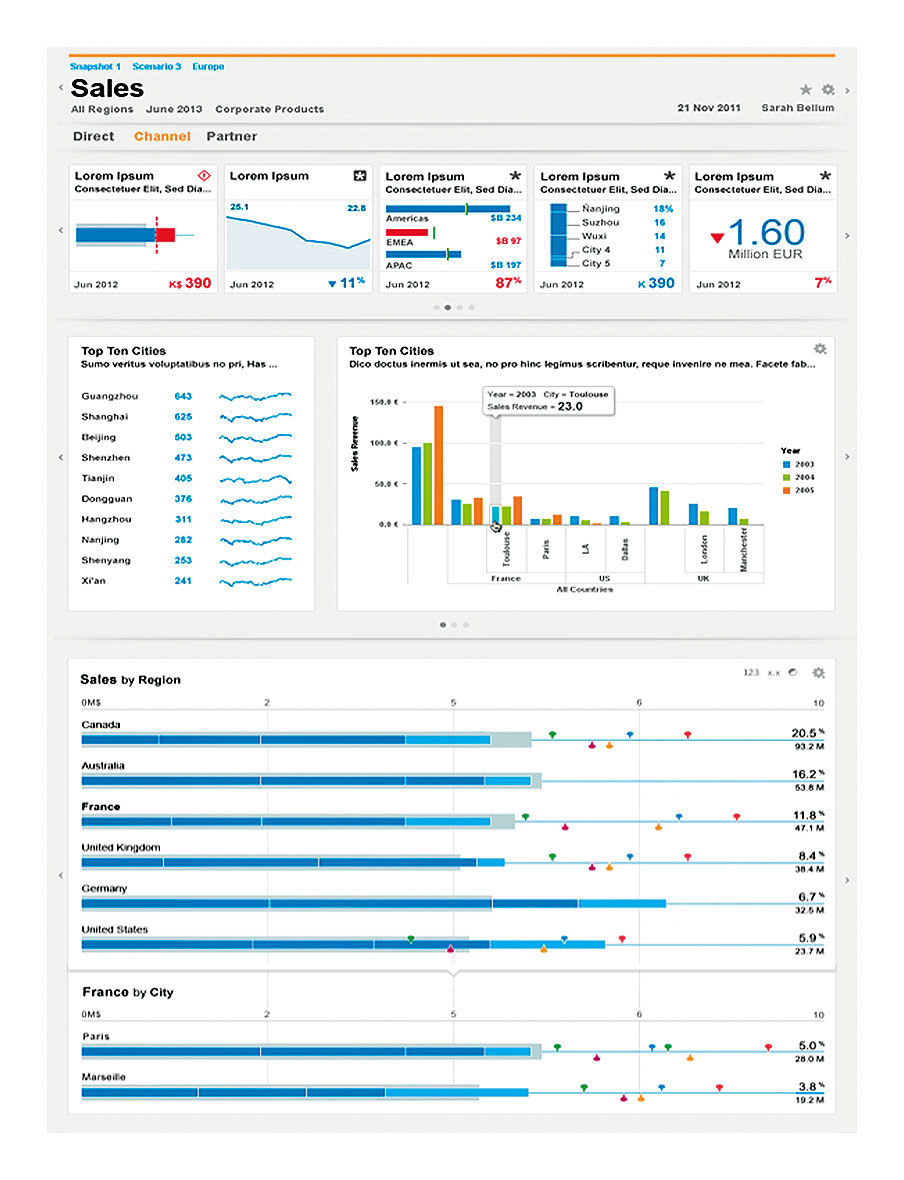 Figure 13.5: LAVA Blocks in a browser page.
All that changes is the data and any local design choices for different chart types and the Measures and Dimensions used for specific topics. An enterprise analytic solution using LAVA provides a unified, consistent, and reliable experience for monitoring and light analysis of all analytic content intended for consumption by any business user.
Because each Board in the Set is represented here by its predetermined Main Point, the Board Set becomes a de-facto, live meta-dashboard, showing by definition what the user has determined to be the most important content from each of their Boards. Also available at the Board Set level is aggregated Feeds from every Board, containing data and usage updates, plus commentary from other Board Members. Users can find and collect individual Points, Charts, and Lattices from their overall Board Set into personal Collections, along with every enterprise Board available to them from the Catalog section. Using LAVA’s predictable and scalable component language, we can imagine an even larger, recursive hierarchy of content for large organizations. Its generation and maintenance could be largely automated, particularly if supported by a specifically instrumented data warehouse, where Dimensions and Measures could drive the generation of Sets, Boards, and Panels, even down to the Lattice level.
Boards are made up of horizontal screen divisions, called Blocks, that are stacked into a single column. The single column is a key to the cross-device continuity of Board design, in that when a Board is shown on wider screens, Board content fluidly expands horizontally without altering the basic layout. Titles and labels can drop any truncations, and horizontal banks of categorical navigation links can be collapsed automatically into picklists, as is done with browser tabs. More minicharts can be shown in horizontally-scrolling channels. Horizontal bar charts can have their scales and display fidelity increased. The overall architecture of the Board and Board Sets can remain intact on a smart phone or even a wearable device.
Scrolling effectively increases the virtual size of your display outside the borders of your window or device, and is a basic convention for digital content consumption that has been ignored in traditional dashboard design. LAVA’s prescribed layout and scrolling properties enable a Board’s layout to maintain its basic model across different devices, with each device’s display acting as a differently sized “window” looking onto the same content “landscape.”
The overall organizational model is consistent throughout all blocks. The vertical, or Y dimension in the overall layout, is ordered by context, with general, low-context content at the top, to more specific or high-context content as one goes down — from the filters to the Digest to the Gallery to the Well and into layers within the Lattice. As you go lower, the content in general is based upon what is shown or has been selected above, be it titles, filters, Lattice selections, and even the user’s cognitive focus. The Lattice is more for detailed lookup and exploration, while the Digest is more for summary monitoring. This convention literally leverages the common metaphor of “drilling down” into higher-context data. The horizontal or X dimension is for navigating amongst peer-level content of generally the same context. The depth, or Z dimension, is for zooming in and out and the layering of detail. It is manifested in detailed hover/touch popup displays – or HTPs – for legends and labels, in the opening of Points into full-sized overlaid chart views, and in the density of content shown in the Lattice rows — such as multiple Measures, badges, and user comments. A final dimension – I call it E – is to exit the Board for more advanced analysis with the same data context as in the Board, but conducted with a more powerful tool like Lumira or Tableau.
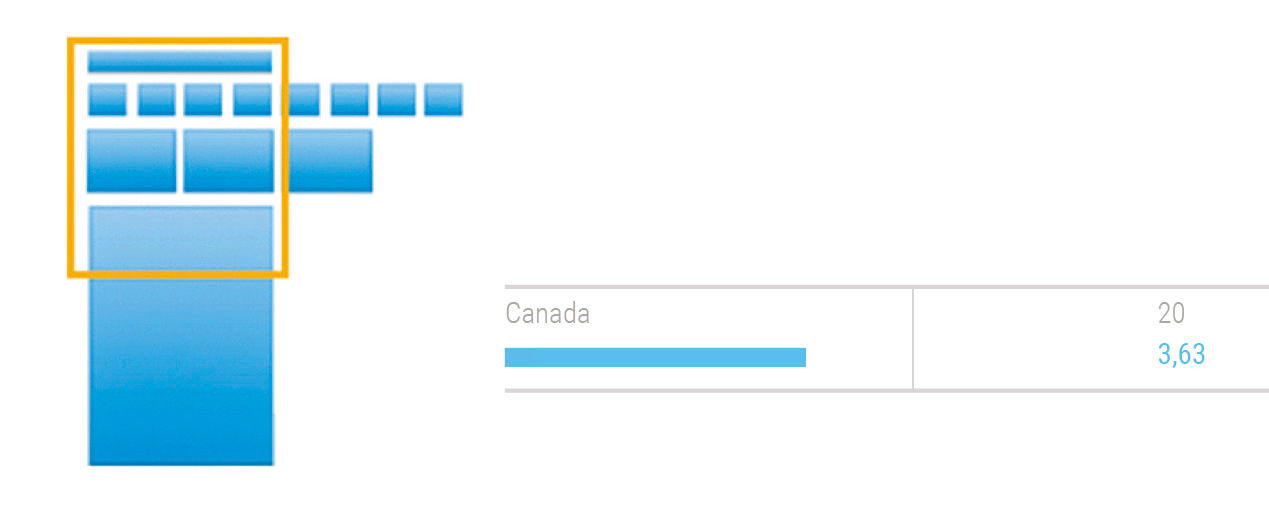
Figure 13.6: A very simple Board and Lattice Row
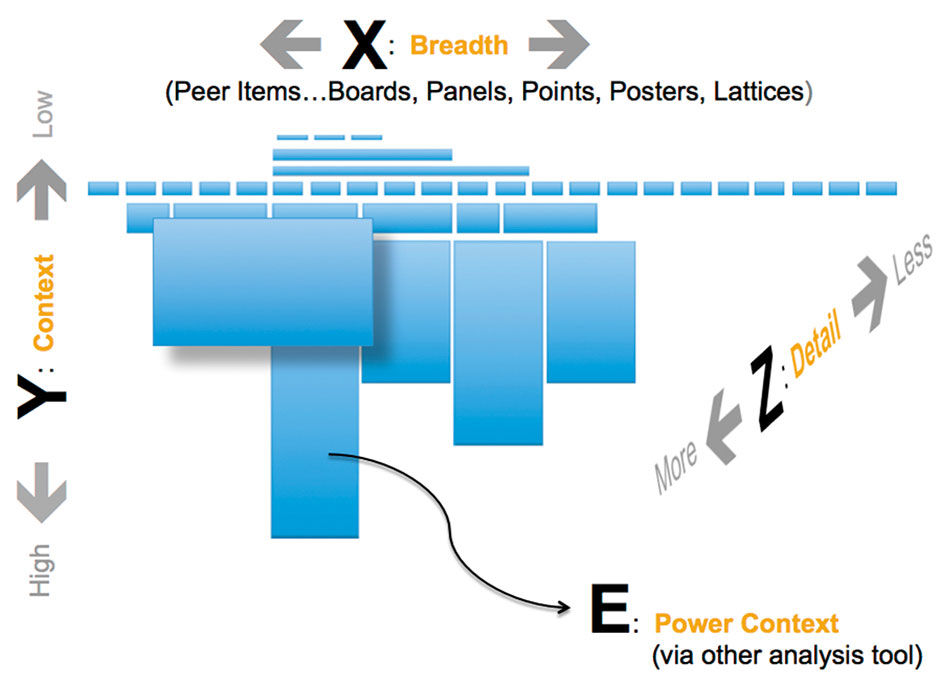
Figure 13.7: General semantic dimensions.
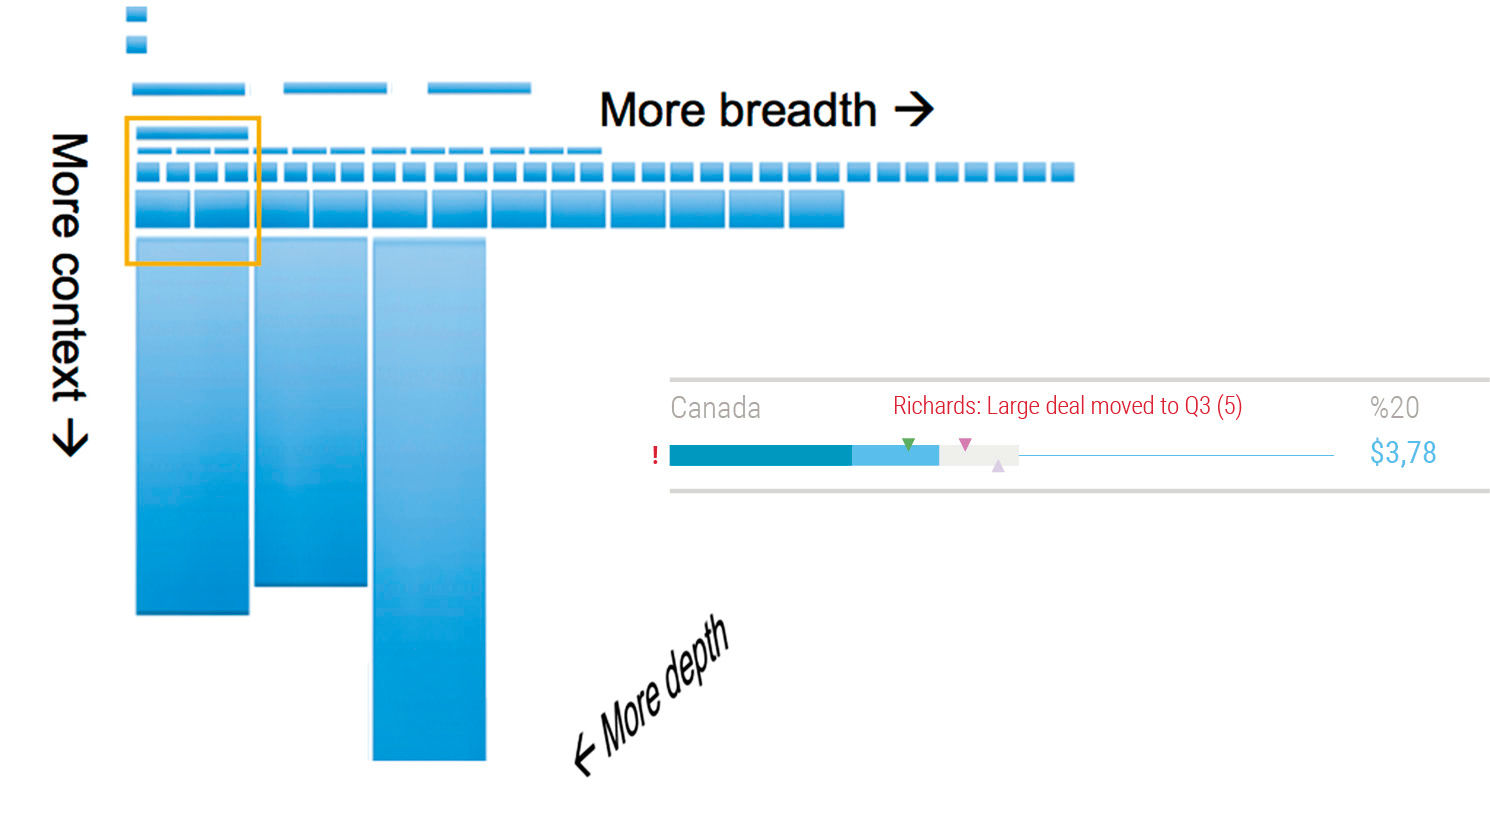
Figure 13.8: The same Board after growth and elaboration of features and data over time.
Because Blocks enable easy expansion without breaking, Boards are quite malleable and can easily change over time without breaking. This is important as some Boards might start out simple and small, but grow over time as more quantity and types of data are added and as authors and more users create their own content.

Figure 13.9: Title Block.
The Title Block contains the Board title, Board Filters & Settings, Utility Button, Branding, and the Home Button. Filters are optional, and this is the only Block where branding logos, colors, and images appear.
Below the Title Block, the Category Block contains the Board’s content subdivisions, shown as a horizontal tab pattern. Overflow tabs are scrollable off screen or accessed from a picklist. Each Category is the title of its own Panel within the Board. Below the Category Block is the Panel, whose top Block is called the Digest Block.

Figure 13.10: Category Block.
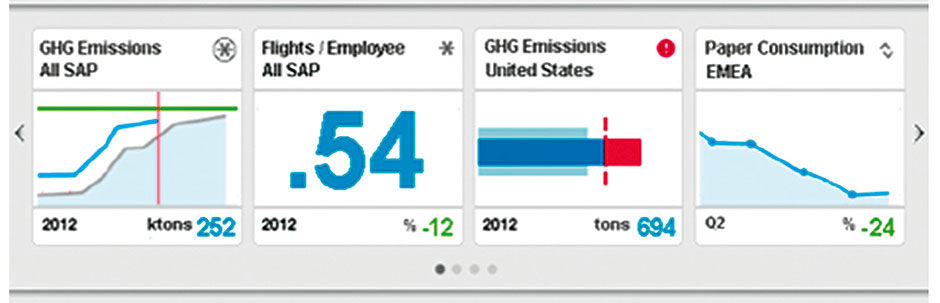
Figure 13.11: Digest Block
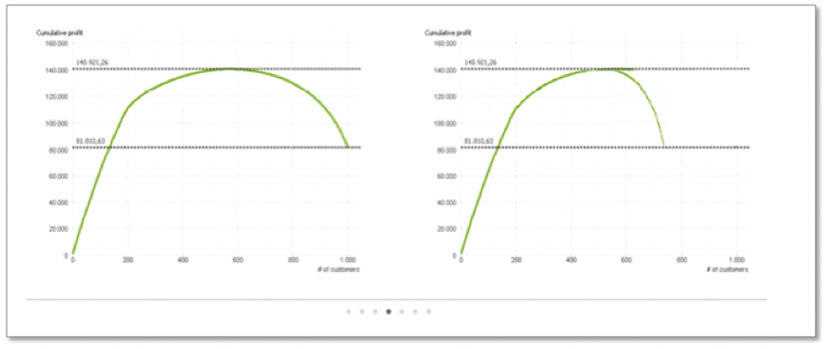
Figure 13.13: “Whaleback” charts, used for profitability analysis, in a Gallery.
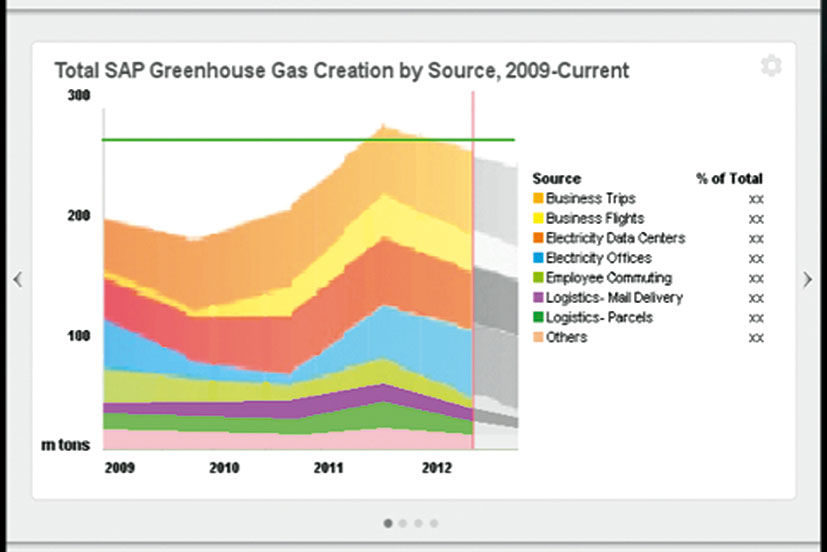
Figure 13.14: A typical chart that could appear in a Gallery as a Poster.
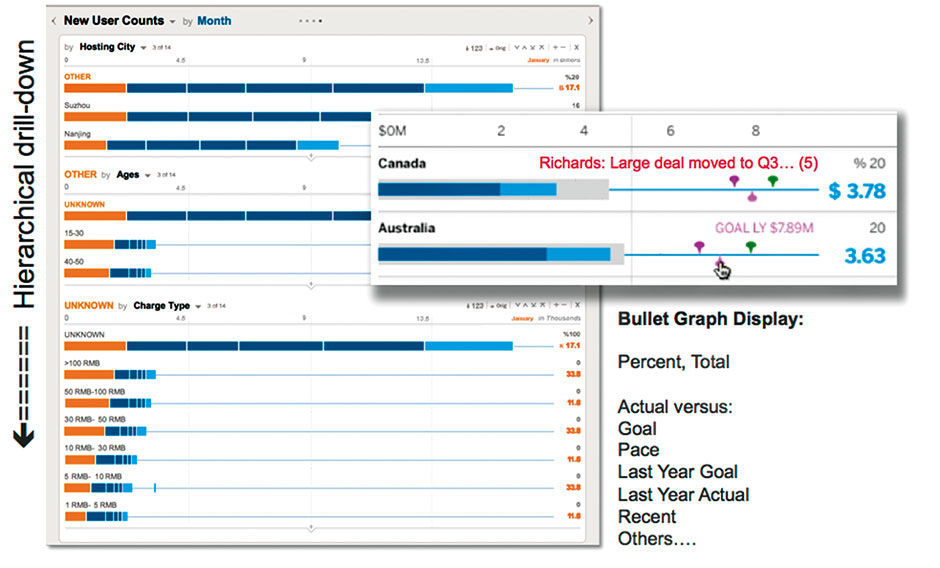
Figure 13.14: Model and view of the Well and Lattice.
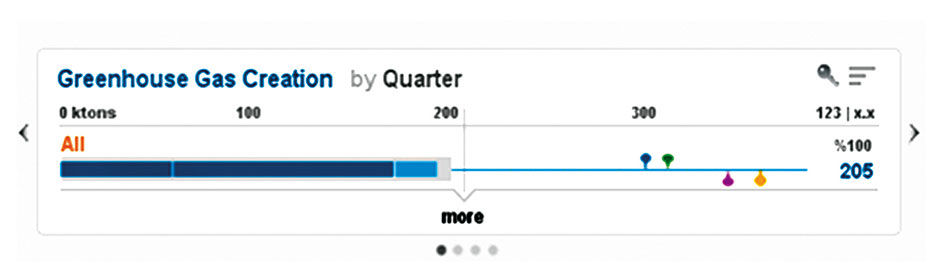
Figure 13.15: The Well Preview.
The Digest is a Channel – LAVA’s horizontally-scrolling content container pattern – for Points, LAVA’s Minichart format. The Digest is where Board authors, users, and algorithms display content in the Point format.
Below the Digest Block is the Gallery Block. This is a Channel devoted to the display of content in the conventional chart format, and uses the same horizontal scrolling to access overflow content off-screen.
The gallery is really just a collection of charts from the underlying data set, and can be authored within the Board itself or via an external application and imported. The Gallery is the safety valve where more exotic chart types, like the one shown below, can be imported if necessary.
The final Board Block is the Well. The Well contains one or more Lattice components according to the underlying data set. The Lattice will be explained in detail later, but is basically a navigable, hierarchical, horizontal bar chart for exploring multi-dimensional data sets. In the Well, the Board’s entire corresponding Data Set can be made accessible in a coherent, unbreakable, navigable, and consumable form.
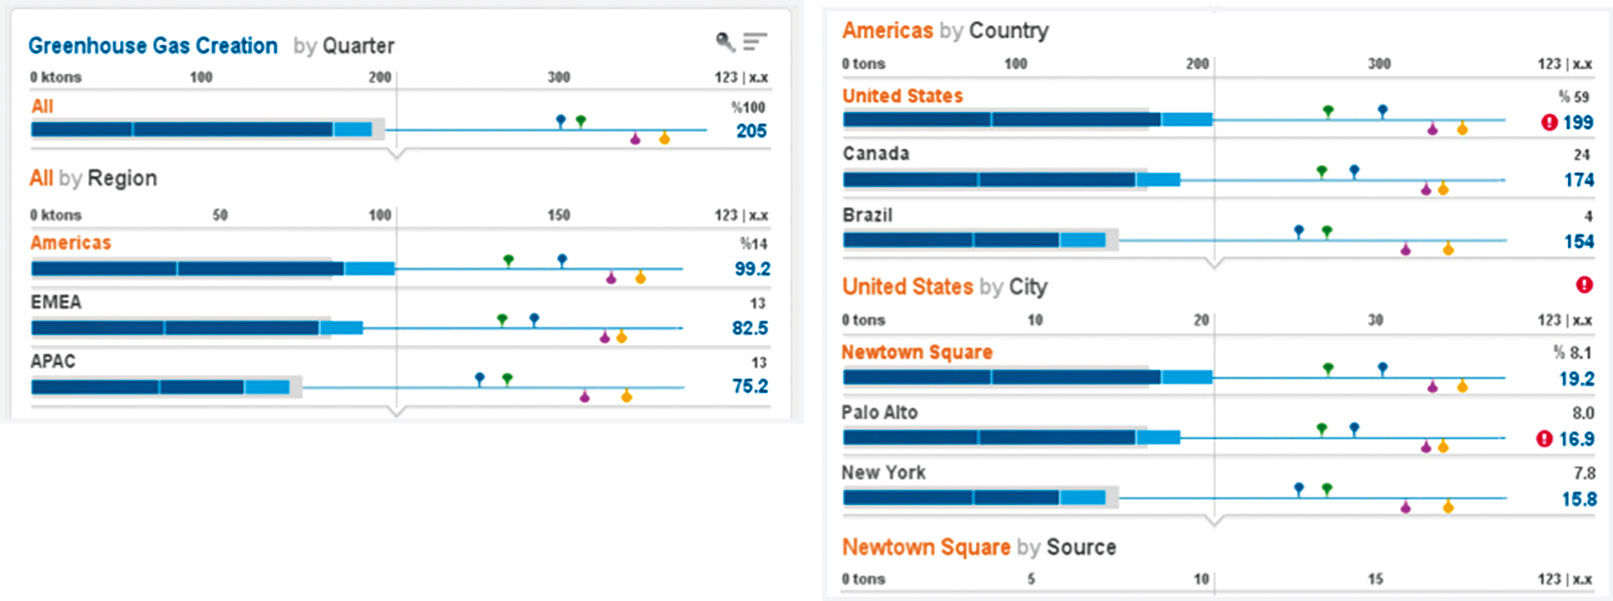
Figure 13.16: Lattice within the Well.
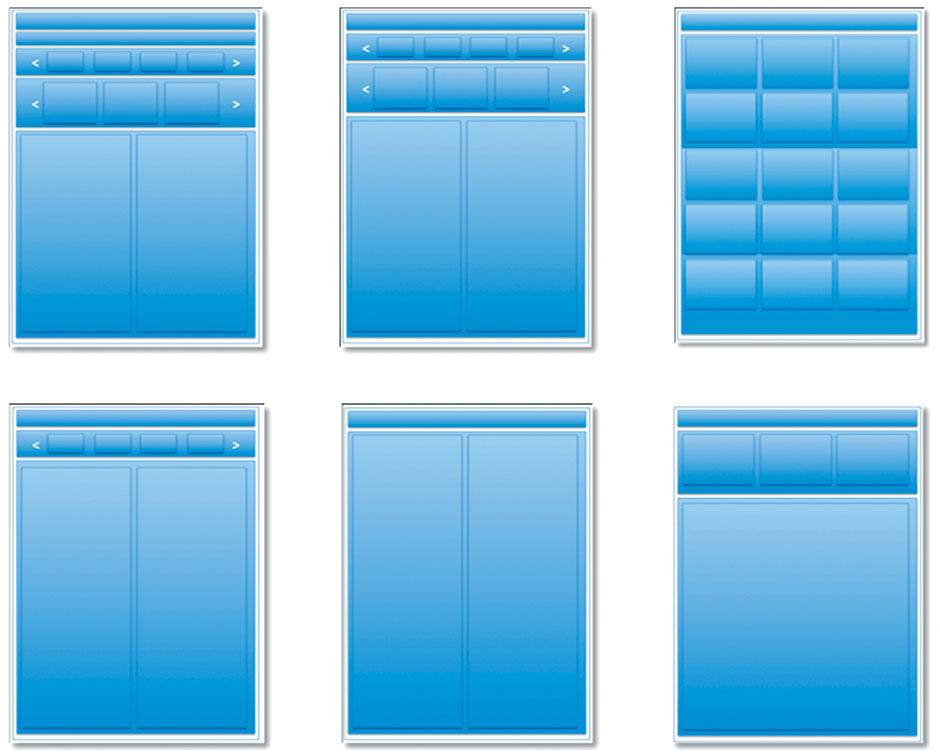
Figure 13.17: Models of several possible Board variants.
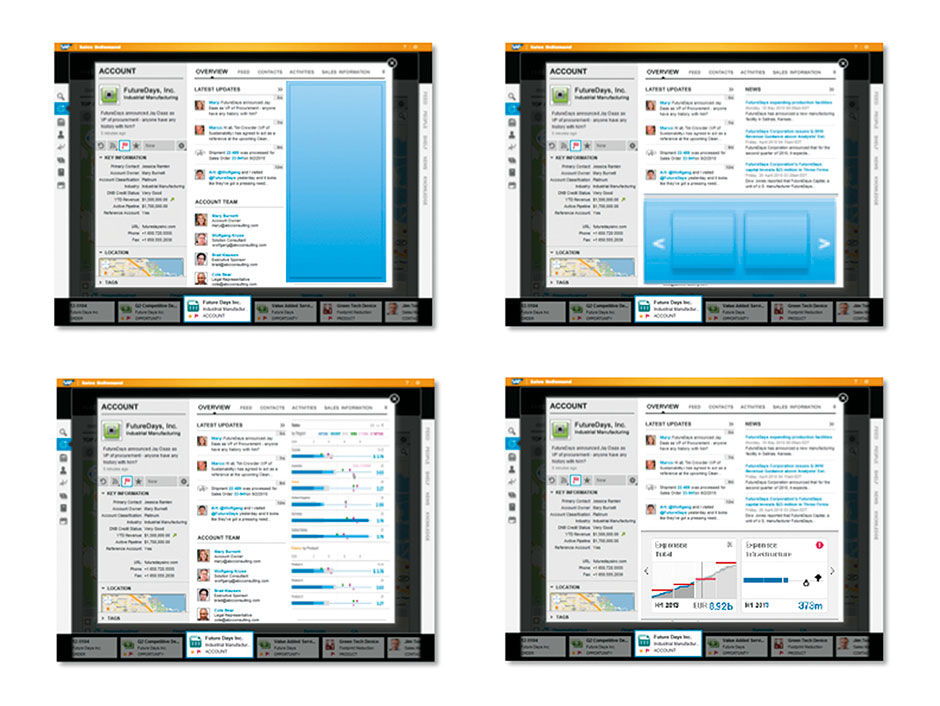
Figure 13.18: How LAVA Lattice and Digest components can be embedded within applications.
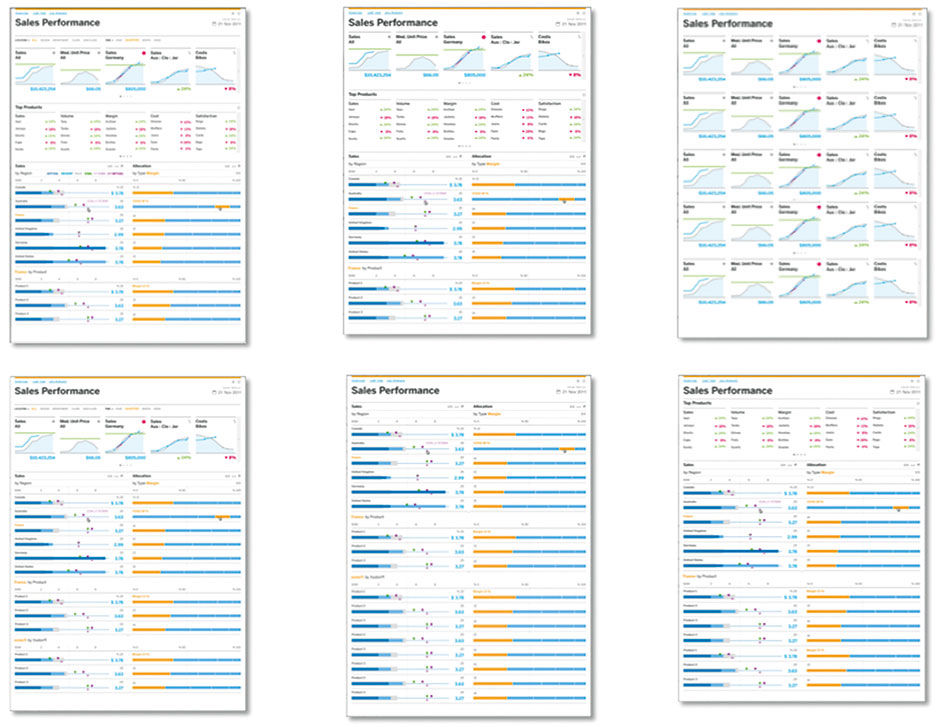
Figure 13.19: Board variant models with sample content.
Blocks, Points, Posters, and Lattices are very embeddable within work-related applications.
While our vision was to have a single Board layout to serve most needs, given the flexibility and interchangeable form of Blocks, it became easy to imagine variant Composites, or Board templates. Authors could have a Board consisting of just a Title Block and a Digest, Title Block and a Lattice, etc. In fact, with the preconfigured simplicity of how the Blocks interrelate, multiple Block combinations could be easy to author manually. Blocks, Points, Posters, and Lattices are very embeddable within work-related applications insert, as in Figure 13.18.
