It’s tough to make predictions, especially about the future.
- Yogi Berra
Not to be confused with the global standard Metric System of measurement, LAVA’s Metric System is derived from the basic business intelligence landscape and its most instrumental unit, the Metric. What I will do is explain and frame this system in a simpler way, to better illuminate the inherent uniqueness and constraints of expressing quantitative content in a form consumable by casual users.
11.0.1 Raw Material: Data, Entities
Any systematic solution is built from modular specialized pieces that interact with each other to create multiple possible combinatorial forms.
Analytics starts with rows in a relational database that record the existence of Entities from the real world, like things, transactions, events, etc. Each Entity is associated with, and defined by, descriptive terms in categories called columns. Rows and columns combine to form database tables that resemble an Excel spreadsheet (Columnar databases flip this relationship for performance reasons).
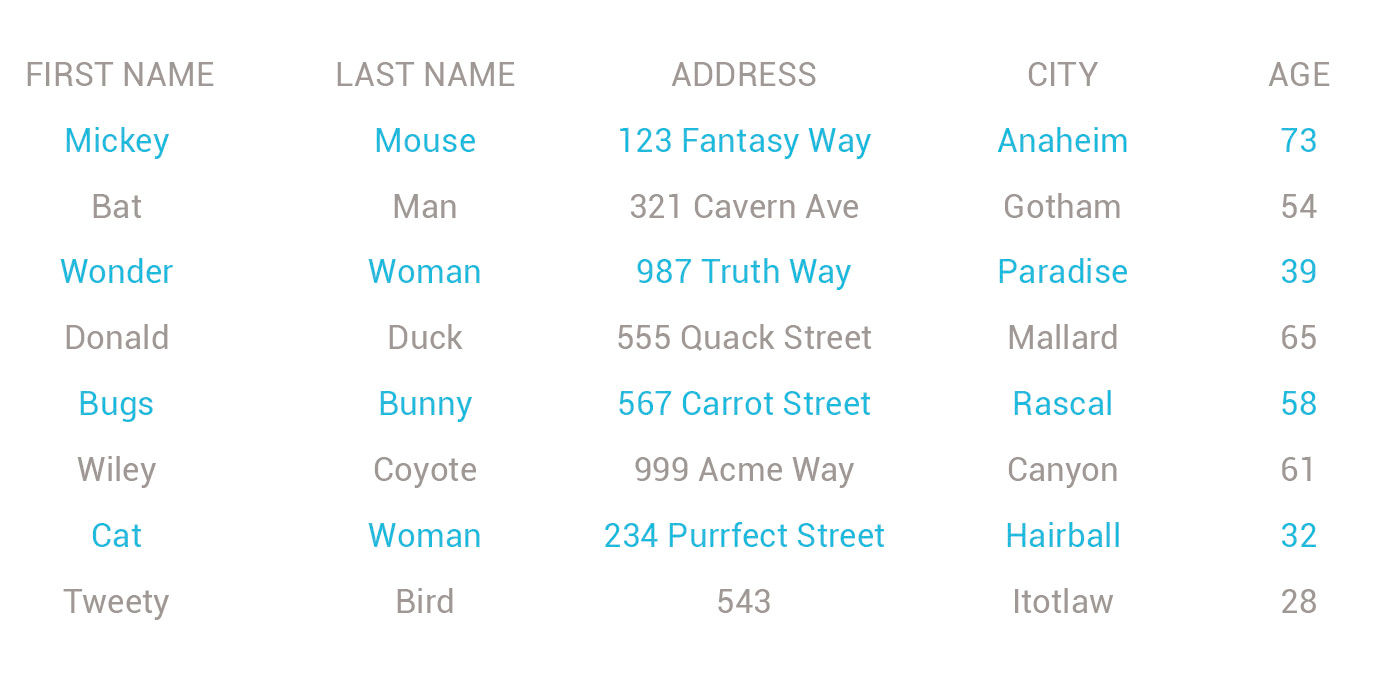
Figure 11.1: Database table.
Multidimensional data sets are converted from this relational database format into a more efficient data structure that allows faster re-organization and calculation of any combination of data subsets or aggregations. Called Data Cubes, these sets convert the tabular columns into one of two categories – Dimensions or Measures – and index all the entities according to their values within these Attributes. Dimensions map to Wurman’s three organization methods of Type, Location, and Time. Measures map to Wurman’s size method. The fifth organization method, alphabetical, is expressed in resulting content displays for sorting and text search purposes. Multi-dimensional data sets have long had specialized Dimensions for time, to reflect its unique organizational and measurement conventions. More recently, specialized location Dimensions are available that leverage the unique spatial data structures from map-oriented Geographical Information Systems (GIS), that are able to calculate position, proximity and distance in multiple spatial dimensions.
In effect, Measures are actually quantitative Dimensions, and along with Time and Location make up the most commonly used types of Dimensions. One way to understand Dimensions is that there are four types: 1) Time, 2) Location, 3) Size, and 4) every other type, or miscellaneous. Other Dimension types might be product type, organizational unit, color, gender, etc. What makes Location and Time different are their unique, standardized organization and measurements systems. Measures are unique in their ability for use in mathematical calculations. Measure values can be added, averaged, divided, etc. What we can do with a data set containing data in all these Dimensions is to find a type of thing (e.g. product) of a certain type (e.g. pants) and size (e.g. large), choose a quantitative property of the thing (e.g. sales amount), and discover the value of sales assigned to a particular location (e.g. New York City) and time period (2013), as well as any other combinations of Dimension values.
11.0.2 Grammar: The Metric
The Metric is a logical quantitative grammatical statement, and can be simple or complex depending on how many elements it includes. The elements can build upon each other in tiers to form increasingly sophisticated expressions. Not every tier is strictly dependent on those below it, but they are put in this order to reflect the typical order of sophistication in which quantitative systems are built.
11.0.3 Tier 1: Entity
The first and most basic element of the metric is the Entity, which in BI terms is known as a Dimension/Member combination, or value pair. If the Dimension is products, the Dimension members are shirts, pants, etc. For numbers to have any meaning at all they need to be given context through labeling. However, even the simple structure of Dimensions and Members contained in a data set has relevance as a catalog of what subjects it refers to. In this regard, BI systems have value even without the application of Measures and Values. While it’s hard to think of an Entity without any associated numerical value, the fact that the Entity exists is numerical in that it counts as a 1 versus a 0. Even the simplest Entity set has a default Measure assigned to it: It’s quantity of Members, or Count. If you just want to know the list of products, a data cube can tell you. In comparison, a list of Member Values without associated Dimension/Member labeling is useless. The Entity provides the subject for the associated Measure data. While entities are not themselves quantitative per se, the fact that they exist in sets, and can be displayed as lists with count sums, gives them an inherently analytic quality. The Metric would appear like this, often called a value pair:
The use of a familiar Dimension like city is a bit misleading, as some entities need more context to be identified. In these cases, the data set can provide its context to the Entity, as here:
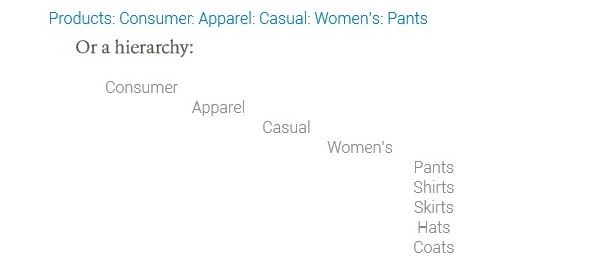
Entities can also be defined through multiple Dimensions, resulting in the following form:
Women’s: Pants: Size 5: New York City: Sale Items
Often these have a geographic dimensional element, which can have unique conventions for hierarchical breakdown and in in the case of GIS systems even a unique database architecture.
Because any data set is likely accessed within a particular decision-making context, a data set’s Dimensions inherit the overall contextual topic that motivates the user to enter. In this case, let’s assume the context to be an enterprise field sales operation.
11.0.4 Tier 2: Value
The second element is the Measure/Value combination. A Measure is a category of quantitative measurement applied to the Entity, and the Value is the particular value of the Measure applied to the Entity. If a Metric has the Entity New York and the Measure Sales, then it displays the total sales and units (in this case a currency) associated with New York in quantitative form, namely a numeric display such as
Sales: Pants: 4.5M USD
This display triad is the foundation of all BI. It has an Entity, Measure, and Value. Most BI starts here and consists of tables full of elaborations on this basic structure. The above Metric and its subject matter, however, beg us to ask for more information. What does 4.5M (abbreviation for 4.5 million) USD mean? What is its context? In particular, over what time period? Without this Dimension displayed, we must assume that this number represents the sum of all sales of all Pants since sales began being recorded.
11.0.5 Tier 3: Time
Because time is an almost universal factor in analysis of events in the world, it is typically the next Dimension applied to most data sets. As Wurman states, time is a Dimension with unique properties and measurement conventions, and is of prime importance to many of the quantitative topics we care about. Time in its simplest form isolates a Measure state to a point in time, such as 8:00AM on 9/11/2011. The Value associated with a point in time would be a state, such as air temperature or stock price, or variants of these, like change versus another point in time. A typical Metric display could look like this:
Sales: Pants: July 31 2014: 1.2 M USD
This still does not tell us much, and all we can assume is that in whatever context this Metric was found, it represents either just 1 day of sales (July 31) or the total of all Pants sold in history up to that point in time.
11.0.6 Tier 4: Change
The next expected layer can take several directions based on what the user wants, but a typical elaboration of this metric is to include the element of change. The change Measure can be shown instead of or in addition to its associated reference Value. It needs two time-based point Values to be calculated. Here is how it can appear:
Sales: Pants: up 200K USD: as of July 31 2014: from June 30 2014
This Metric gives us more context on the Measure value by comparing it to another period in time. Depending on the statistical sophistication of the time context, such comparisons can define a trend.
11.0.7 Tier 5: Period
An extension of Time measured as a point, or state, is the use of time as a Dimension that is divided into members consisting of periods like days, months, years, etc. or any custom time span. Measures for period can include sum, average sale size, change over period, etc. The Metric can appear with the change Measure applied:
Sales: Pants: July 2014: 2.2 M USD: up 5% from LY
LY stands for “Last Year”, implied here by convention to mean “July Last Year”. The implied meaning of a Value associated with a time period is the sum of the Measure during that period.
11.0.8 Tier 6: Assesment
A Tier 5 Metric provides a lot of information, but still missing is an assessment of whether the number is good or bad – in this case, whether it met expectations or goals. While the Value may appear to be a good outcome in that higher sales are generally a good trend, in fact the number might be a bad outcome if the plan called for a greater increase in sales. If a plan, or goal, Measure exists, comparing the actual sales to the plan can convey this. The Metric could appear as binary:
Sales: Pants: July 2014: 2.2 M USD: up 5% from LY: Underperform
Or as a scale:
Sales: Pants: July 2014: 2.2 M USD: up 5% from LY: 2% under goal
11.0.9 TIer 7: Interpretation
The next questions a user might ask are “how did Pants sales compare to other items?”, which could be answered by including the Metrics from other products, or “why did Pants not achieve the goal?”, which could be answered by a root cause analysis. The latter is more complex, achievable through a more detailed analytical breakdown of Pants types, sizes, geographies, etc. to discover patterns, outliers, etc. If the cause is know it can be displayed somehow:
Sales: Pants: July 2014: 2.2 M USD: up 5% from LY: 2% under goal:
Caused by sales force attrition
11.0.10 Tier 8: Prediction
This chapter’s opening quip about predictions, as with the others attributed to Berra, is not naïve or entirely sarcastic. Gathering reliable facts about even past events can prove difficult. Analytics deliver value by presenting facts of what has occurred in the past as evidence and insight for why things occur as they do. Of immensely greater value is knowing in advance what will happen in the future, but apart from predictions on the scale of astrophysical phenomena, this is of course quite difficult. If predictive Measures are available, the next Metric tier builds upon the others with predictions of what the prime Metric Measure, in this case Sales, will be in the future. Other Measures, such as likely causes for future failures or successes can be predicted, including a Measure of the confidence of such predictions expressed, for example as with precipitation forecasts, with percent certainty. This could appear as:
Sales: Pants: July 2014: 2.2 M USD: up 5% from LY: 2% under goal: Caused by sales force attrition: August forecast under goal by 3% (confidence 80%)
The simpler Metric Measures need not be present when presenting more advanced ones. For example, a signature use of the predictive product from KXEN, a company acquired by SAP, was to embed a Measure Value within call center software. KXEN enabled a CRM display showing the call center worker the percentage odds, based on a predictive model that the customer they were talking to by phone would buy a certain product or promotion. In cases of strong odds, workers can be directed to suggest the offer verbally.
11.0.11 Tier 9: Action
This final tier begins to close the loop on insight to action by proposing appropriate actions for users to take in response to a Metric state. These might link to more details about the action, or an application for carrying it out. For example:
Sales: Pants: July 2014: 2.2 M USD: up 5% from LY: 2% under goal: Caused by sales force attrition: August forecast under goal by 3% (confidence 80%): Recommend hiring sales people: Start Here
This is simply an illustrative example, and a risk of providing such recommendations is that they appear obvious or even condescending. However, in well-understood and constrained contexts, there is definitely value in providing suggestions as to why something happened and what can be done. As these expressions begin to provide more detail, they become more cumbersome to consume, as they need to be read in a linear fashion. In fact, logical expressions like these can be parsed into grammatical sentences that can be consumed via written or even voice format:
Sales for Pants for July 2014 were 2.2 M USD. This is up 5% from July last year but 2% under the goal. The likely cause was sales force attrition. There is an 80% chance that August sales will be under the goal by 3%. Consider hiring salespeople by starting here
You can imagine such statements being read to you by taking heads on TV, or by Apple’s Siri. I already discussed SAP’s Successfactors product and its proposed hybrid natural language / visual analytics solution. This type of solution resides between the categories of artisanal, custom-built analytic solutions and generic ones. In the horizontal LOB domain of HR management, KPIs and operational use cases are well understood and appear in all or most organizations. Software vendors can provide pre-configured but customizable reports, analysis paths, and action functions according to generic needs within the specific domain – in the case of an HR manager, for example, reporting and transactional workflows related to attrition and other workforce issues. Such solutions are, as with all pre-configured business software, prescriptive artisanal solutions applied to broadly prevalent use cases.
Although the ability to narrate analytic content using natural language is appealing, it lacks the unique powers of geometric visualization to convey information quickly and efficiently, or the ability to reveal patterns in larger and/or less-understood data sets, where analysis patterns and conclusions cannot be easily automated.
