We spotted the ocean at the head of the trail
Where are we going, so far away
And somebody told me that this is the place
Where everything’s better, everything’s safe
Walk on the ocean
Step on the stones
Flesh becomes water
Wood becomes bone
- Toad the Wet Sprocket, from Walk on the Ocean
When I moved to San Francisco from the east coast in 1995, it was mainly for two reasons. The first was for the Bay Area’s high tech industry. After two years teaching myself interaction design at a multimedia publishing company in New Jersey, I was smitten by the role and the challenge of mediating the dialog between people and machines. In my case, the machines were computers and their software, and being what was then called a user interface designer was the perfect merger of my education in systematic, information-oriented graphic design with the ergonomic challenges of product design. Graphic Design is essentially the design of communication via two-dimensional surfaces. The user interface – or UI – of software is essentially the depiction of what a machine is and can do – called its affordances – and its state and the state of whatever the user is doing with it. This is done mainly via an ongoing input/output dialog mediated through a two-dimensional screen display. It was a fun time to enter the field because it was young, with so many basic issues left to be discovered and resolved, and the most interesting work was being done in and around Silicon Valley.
The second reason I moved was for the local windsurfing scene. The Northern California coast, and specifically San Francisco Bay, is a world-class windsurfing location. Windsurfing requires access to two basic ingredients: Large bodies of water, and wind. The latter is by far the more rare of the two, for high-level windsurfing requires strong, steady winds exceeding 20 mph. What makes San Francisco Bay so special for sailing is the presence of winds that are strong, steady, and predictable, due to a combination of cold ocean water fed from the North Pacific, a hot and dry inland climate, and the low coastal mountains punctuated by gaps like that of the Golden Gate. From March to October, most days repeat a cycle of the dry Central Valley heating gradually throughout the day, creating a low-pressure “bubble” of hot air that rises and sucks the air from surrounding areas to fill the vacuum. Most of this is drawn from the mass of cold, wet air hovering above the Pacific Ocean just off the coast, which most afternoons comes pouring in through the mountain gaps, smothering San Francisco in fog and sending winds pouring into the bay and all the way to the Sacramento River delta up to fifty miles inland. It is these afternoon surges, with winds up to 40 mph, which attract windsurfers like catnip.
Unlike traditional sailboats, windsurf rigs have a nearly linear relation of performance to wind speed. This means that up to a point, the faster the wind, the faster the windsurfer can go. This is because at full speed, windsurf board hulls ride on top of the water – called planing – versus riding in the water as with most sailboats and other watercraft. This drastically reduces drag, and when the board reaches planing speed it accelerates like an arrow leaving a bow. Because the mast rests on the board with a pivoting universal joint, windsurfers can use their body weight to lean the sail back against the wind. This keeps the board flat on the water and keeps the sail at it’s optimum position, the latter behaving more like a wing in the wind than as a barrier, and transferring more of its force down to the forward motion of the board. It’s exhilarating, great exercise, and environment-friendly.
Had my older brother not introduced me to the sport during my highschool visits to the Florida Keys, I likely never would have had the interest and confidence to start. But I did, and when living in Providence, Rhode Island for graduate school I bought his original Windsurfer brand board and sail, and began the long, humbling learning curve towards the ability to zip around at up to 40 mph on oceans, lakes, and rivers, powered only by the wind. When my career took me back to Ohio and then Northern New Jersey, I tried to keep up the sport, but doing so in these locations was a challenge. The problem is that as your windsurfing skills advance, you lust for greater performance and challenges, and these can only come with high winds and/or big waves and surf. Big winds in the Midwest and Northeast usually come in fall and winter, when the air is so cold that windsurfers need protective wetsuits, including hoods, mittens, and boots, that when combined with numbness from the cold reduce much of the sensorial buzz from the entire affair. Winds are unpredictable, requiring windsurfers to drop everything to appear at their sailing site exactly when the winds peak. One time in Ohio I left work early to catch an early spring gale, only to find that the lake was still frozen over. It was maddening, and explains why the Bay Area is so special. Not only are there perfect ocean waters and strong winds here, but they reside dead in the center of an enormous metroplex with great quality of life and career opportunities. While I get on the water 30-35 days per year, for some windsurfers the days can number well over a hundred. It’s like having the ski slopes of Aspen or the Pebble Beach golf course right in San Francisco.
Note that windsurfing is often confused with a more recently invented sport called kitesurfing. Instead of having a traditional sail attached to a surfboard, kitesurfers ride on a much smaller board – similar to a snowboard – and tie themselves to a large C-shaped inflatable kite that pulls them around on the water. Because kiters need much less wind than windsurfers to get up and going, theirs is a much mellower existence.
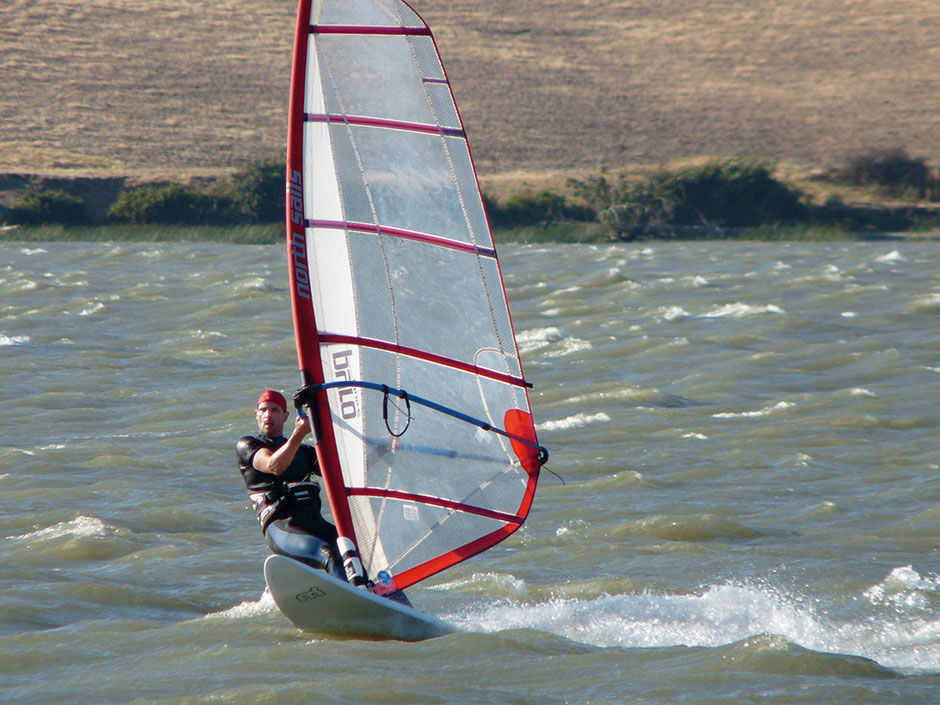
Figure 1.1: The author windsurfing on the Sacramento River.
OK, what does windsurfing have to do with visual analytics? Visual analytics, as I define it, is the viewing, manipulation, and analysis – what I call consumption – of quantitative data through visual means – charts and graphs versus primarily numbers in columns and rows. Its pictorial aspect, versus the more abstract symbolic representation as with numbers and columns, enables key aspects of data to be more easily perceived. Windsurfing, as with all sports, involves complex dynamic forces that need to be understood and mastered to achieve success.
Figure 1.2: Ferry Chase Windsurf Video
To the extent that we can record, visualize, and manipulate these forces, mastery is easier to achieve. Because windsurfing is a recreational pursuit, the idea of poring over spreadsheets and complex weather models to improve performance is not appealing to most windsurfers. However, if the forces behind the fun can be revealed in a simple, convenient, and engaging format, people will pay attention and benefit. I chose this example because it’s something I’m qualified to explain, but also because it presents a vivid use case of emerging potential, in particular that of environmental sensors – an important part of the Internet of Things or IoT– and the social, physical, and recreational dimensions for which numbers are becoming more relevant.
Because wind speed is critical to performance and thus the amount of fun, windsurfers are obsessed with it. It’s similar to how traditional surfers are with wave height and skiers are with snow conditions, only more severe. Because the real windsurfing begins when the board jumps onto a plane and accelerates, a windsurf session in wind speeds below what it takes to reach a plane is pretty dull. In fact if the wind drops too low, some winsurfers’ small, high-performance boards – called shortboards or “sinkers” – move too slowly and have insufficient flotation to support their windsurfer on the water. Because of this, not only are windsurfers obsessed with seeking high wind, they are just as keen to know when the wind will stop. To avoid being stranded far from shore, windsurfers need to judge where on the water the wind is blowing, based on signs like wave patterns on the water, blowing trees and flags, and sailboat behavior. Often times the best wind can be a mile or so off shore from where the windsurfers launch, requiring a long slow “slog” to the wind line and back. If a windsurfer misjudges the wind strength, they may face a long swim back to shore or may need to be rescued by a passing boat or even the coast guard. In almost twenty years of bay sailing, I’ve had to be rescued twice, the second time by an enormous barge tug whose crew plucked me from the bay on the beginning of a long and tiring twilight swim against the current. They retrieved my abandoned sail, then fed me dinner while waiting for the small coast guard rescue boat to pick me up. For windsurfers, wind speed is the most important of several key Measures involving the practice of the sport.
There are other factors as well. I mentioned air temperature, and the fact that windsurfing below 40 degrees Fahrenheit is rarely worth the associated discomforts. Another is wind direction, because this determines which directions any sailing craft can travel and thus influences where windsurfers choose to get into the water, or launch. Wind direction can also affect where the wind might be blocked by hills or buildings, and thus creating “wind shadows”. For ocean windsurfing, tides are important as well. Not only do tides affect water depth, but they also create strong currents when in transition. Low tides can make some locations too shallow for windsurfing, and currents can make windsurfing better or worse depending on their direction. It’s better for the current to flow towards the direction the wind is coming from, because in effect any object floating on the water is being carried by the current into the wind, thus increasing the relative wind speed experienced by the object. Someone adrift on a raft in a 5mph current heading into a 20 mph wind will experience a 25mph wind. Likewise, a current running with the wind has a detrimental effect on experienced wind speed. Tides advance and recede roughly twice per day, on a shifting time scale resulting in high and low tides occurring at different times each day. Other factors are important too, if somewhat obvious, like the time of sunrise and sunset – it’s hard and unsafe to windsurf at night – and water temperature – warmer is better, colder requires a wetsuit, and frozen is a deal breaker. Finally, there is the travel distance from where the windsurfer lives to where the wind happens to be blowing at the time, the related traffic conditions, etc.
Against this array of complexity, windsurfers adapt to conditions by choosing from among different boards and sails before going on the water, and by adjusting them once there. In regard to analytics, these variables might ring a bell if you follow the America’s Cup sailing competition. The 2013 race was held in San Francisco Bay, and resulted in one of the most dramatic come-from behind victories in sports history. Team Oracle from the United States overcame a huge point deficit to defeat Team New Zealand in the final few races, attributing their dramatic turnaround to adjustments made to the boat and sail based on analyzing recorded performance data and their relation to the sailing conditions. On a much simpler level, windsurfers can have several boards, typically a larger board for light winds and smaller waves, and a smaller board for high winds and for easier maneuvering through rough water. They also carry multiple sails, differing by size to suit higher or lower wind speeds. In light winds, large boards and large sails enable the fastest board speeds but are relatively heavy and cumbersome, thus limiting agility. As wind speed and wave heights increase, windsurfers choose smaller boards for their greater speed and agility, and smaller sails that help to manage the force applied by the wind and thus allow the windsurfer to maintain control of the rig and reduce fatigue. For advanced windsurfers, having small gear in high winds is ideal. Small boards and sails are light, fast, and agile, enabling the dramatic turns and jumps that make advanced windsurfing so much fun. In general, windsurfers try to use the smallest gear they can to keep the board moving fast enough to stay on a plane, typically from 10–15 mph. By rigging a larger sail, they can increase power and sail faster, but will sacrifice agility and control, and likely fatigue faster.
The final element in the equation is the body weight, and to a certain extent the height, of the individual windsurfer. Larger, heavier windsurfers need larger boards to keep them afloat in light winds and to plane sooner, and larger sails for the extra power necessary to propel the extra weight. The best measure of board size is its volume, or how much water it displaces. Board volumes range from about 60 to over 200 liters. Sails are measured in square meters, and range from about 3 to 9 meters and above. At 6’5” and 215 lbs., I’m heavier than most bay windsurfers and my height gives me extra leverage on the sail, so I almost always have a larger board and sail than anyone on the water. My boards are 92 and 115 liters, and my sails range from 4.2 to 7.3 square meters. With my large board and sail, I need an 18mph wind to get planing, and with my small board and 4.2 sail I’ve sailed in winds up to 45 mph. Most Bay Area windsurfing days have winds from 20-30 mph. The key to a good windsurfing session is choosing the right equipment for the current and likely future conditions on the water. I even developed a formula for calculating relative ideal sail sizes for given wind speeds based on body weight and height. I posted it on a forum and was good-naturedly ridiculed for taking it all too seriously.
If you look back at the previous paragraphs, you’ll notice how many numbers appear. For such a simple, low-tech sport involving getting blown around on the water for recreation, there are a lot of interrelated quantitative factors involved. And to make it more complex, San Francisco Bay is fragmented into a number of micro-climates. I mentioned the contrast between a 55f temperature at the beach and a 100f temperature merely 50 miles inland that serves to power the overall wind up and down the coast. However, based on the local topography of the coastal mountains, even adjacent neighborhoods in San Francisco can have 15-degree temperature differences and be divided by a wall of fog. The strongest wind typically occurs in the several miles directly in front of the advancing fog bank, and while the overall wind direction is from the ocean onshore, minor variances of direction and fog location can cause the wind to blow stronger or weaker at any of the shore locations where it is convenient and safe for windsurfing. In my neighborhood, across the bay in Berkeley, we are enveloped by a long finger of ground-level fog streaming in from the Golden Gate. Sometimes I can drive a quarter mile north or south and emerge abruptly from dense fog into bright sunshine.
When I first arrived in San Francisco, choosing the right time and place for the afternoon’s windsurfing was an art form. For the right conditions, windsurfers assemble and launch their rigs from anywhere with parking and water access, but most flock to waterfront parks like Crissy Field near the Golden Gate Bridge. Experienced local windsurfers would use their intuition about how weather conditions, like the temperature and air pressure in the central valley or the proximity to the coast of the Pacific fog bank, would affect the location and strength of the day’s wind. As with local temperatures and fog banks, the wind could be 30 mph at one launch spot and 10 mph at one a mile away. Although the national weather service operated free phone hotlines with automated wind speed direction and speed reports at key locations like the Golden Gate Bridge and San Francisco Airport, circles of friends used phone trees, leaving voice messages on answering machines about where it was blowing already and where everyone should meet. Tide information was available via free booklets given out at the windsurf shops, but it was rarely specific to the launch locations. The game was to predict the most optimal combination of maximum wind speed, favorable tidal current, and minimal drive time, achievable within a 3-5 hour window slotted between any other schedule commitments of the day, and along with other minor factors like location preferences and amenities.
One technique I often used was to commandeer the web-based live video camera on the roof of San Francisco’s Exploratorium science museum. After waiting in line for up to five minutes or so, anyone could get a 30-second turn to operate the website controls to train the camera’s live feed on any of five predetermined viewing angles. One of them had a perfect view of the windsurf beach at Crissy Field, and from the grainy video I could get a sense of the wind speed and, if windsurfers were on the water already, how fast they were moving.
In general, while much more reliable than it was on the east coast and Midwest, finding good windsurfing conditions on the Bay was still a hit-or-miss affair. Everyone gathered as much evidence for the best place to go, and then made the call. In my experience, one in three attempts was a failure, with each attempt occupying up to a one-hour drive each way, and idle time on the shore. You showed up and waited for wind, and sometimes it never came. You might hear later that it blew at another site, or at none at all that day. While similar to snow conditions for skiers, it was a much more severe outcome, as not having enough wind is like having no snow, or more accurately, no mountain to ski on. I endured this situation because at the time, being single and childless, I had few time commitments. Every weekend was an adventure. Sometimes I would visit three sites in an afternoon before finding wind. My dog Leo and I would wander in the car like gypsies, and while I had a friend that also windsurfed, the odds of our schedules aligning was slim, so my weekends were mostly a solo affair.
To UX researchers and ethnographers, this account of the SF Bay windsurfing scene might read like a formative user research report, created to inform a subsequent product design effort. Had such an effort been conducted in 1995 – and maybe it was – iwindsurf.com is the product it would have spawned.
Now in 2015, the situation is quite different. The company Weatherflow, through its websites iwindsurf.com and windalert.com, provides real-time micro-weather information, particular related to wind and water conditions, targeted at windsurfers and other wind-and-water enthusiasts around the world. They began by publishing relevant public forecasts and streaming live condition readings from public sources as a free service. Over time they invested in the installation and maintenance of wind sensors at key locations near popular windsurfing spots, whose live solar-powered data feeds now appear alongside the public data for paying website members. Instead of a stressful series of phone calls to hear the wind speeds at the Golden Gate Bridge and the airport, and then thumbing through a paper tide booklet to triangulate where the best conditions would likely occur for the least driving time, for $10 per month windsurfers can log in from any computing device and see visual renderings of precise forecasts and conditions at our favorite locations. Here are mine:
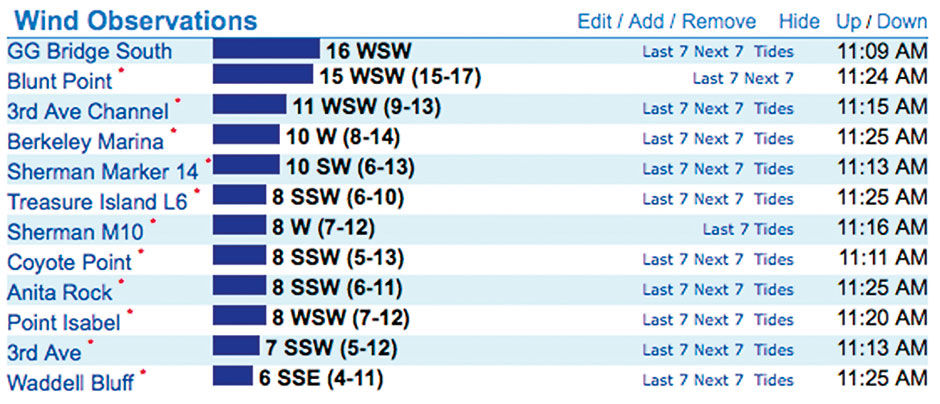
Author/Copyright holder: Weatherflow, Inc, www.iwindsurf.com. Copyright terms and licence: All rights reserved
Figure 1.3: Iwindsurf.com: My IW wind conditions, showing average wind speed, direction, and gusts-lulls for the previous 10-20 minutes.
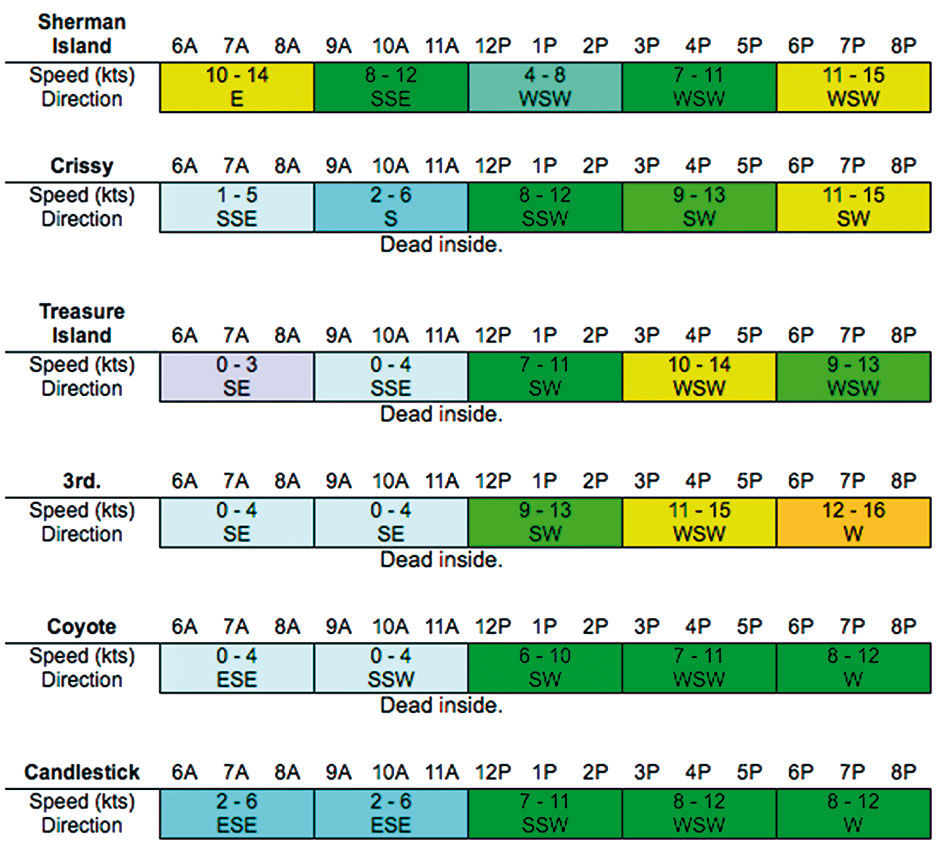
Author/Copyright holder: Weatherflow, Inc, www.iwindsurf.com. Copyright terms and licence: All rights reserved
Figure 1.4: Iwindsurf.com: View from My IW Forecast, a heatmap forecast of wind conditions in three-hour blocks throughout the day at multiple launch sites. Speed in knots is comparable to speed in MPH.
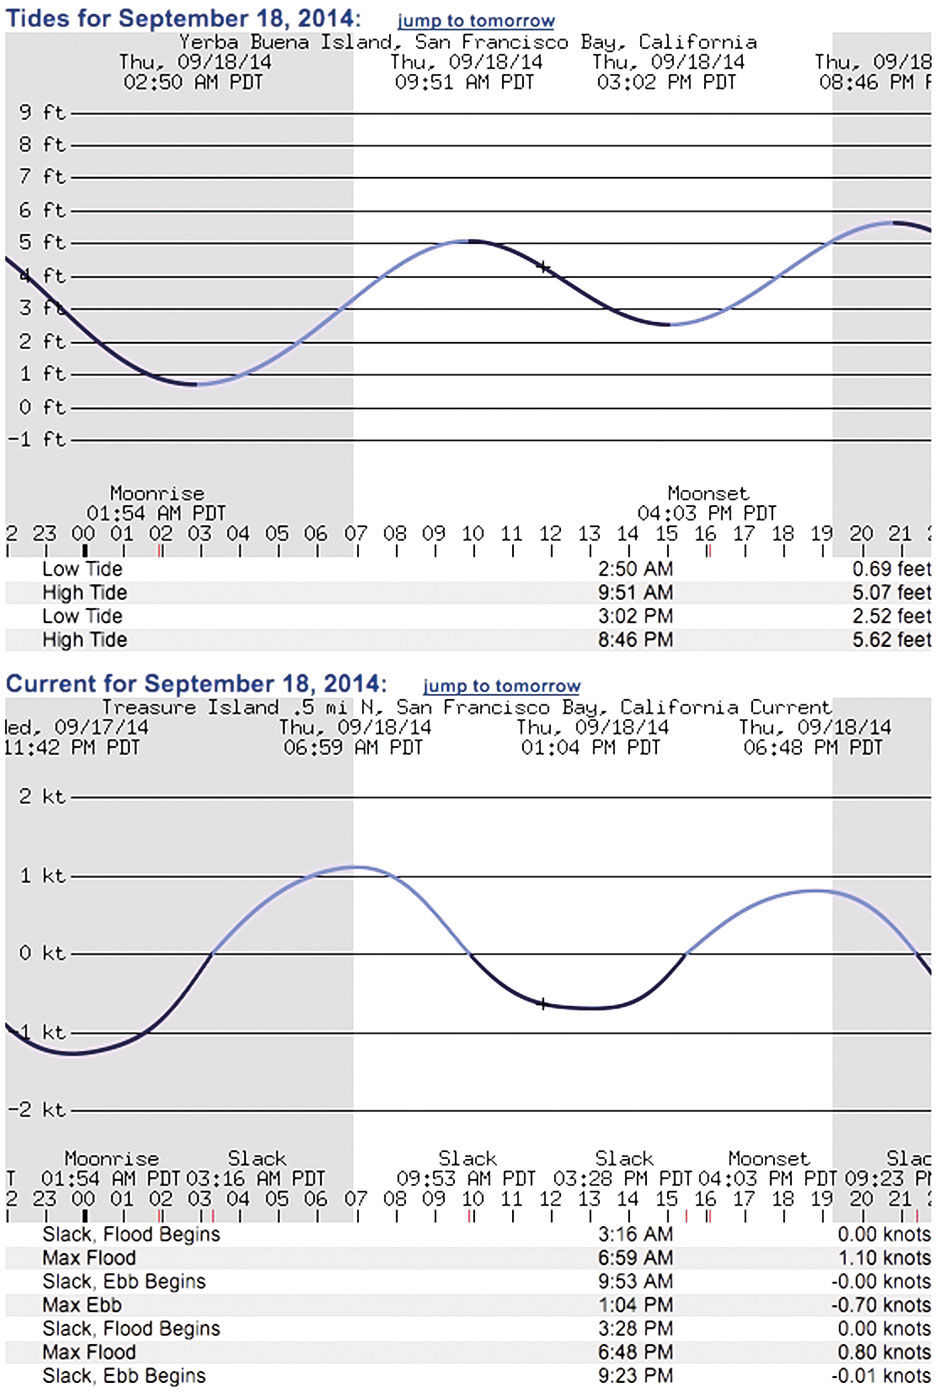
Author/Copyright holder: Weatherflow, Inc, www.iwindsurf.com. Copyright terms and licence: All rights reserved
Figure 1.5: Iwindsurf.com: Tide report for the launch at Treasure Island, with tide level throughout the day at top, and the associated current speed in/out of the bay.
Author/Copyright holder: Weatherflow, Inc, www.iwindsurf.com. Copyright terms and licence: All rights reserved
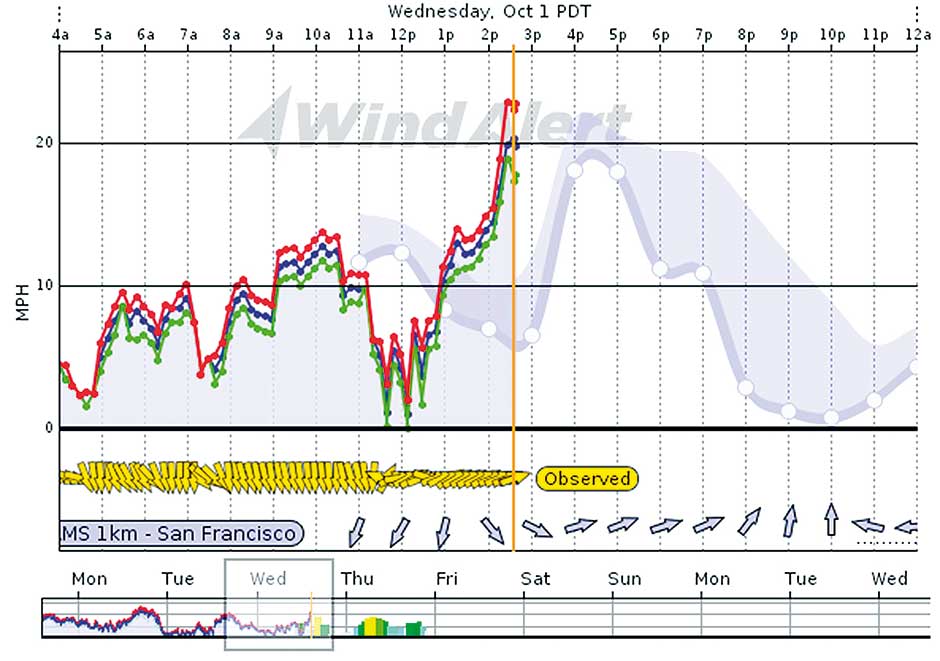
Figure 1.6: Iwindsurf.com: Current and historical wind observation with average, gust, and lull values (blue, red, green lines), arrows with direction, and forecast for Treasure Island in San Francisco Bay. The wind arrived two hours earlier than forecast.
Author/Copyright holder: Weatherflow, Inc, www.iwindsurf.com. Copyright terms and licence: All rights reserved
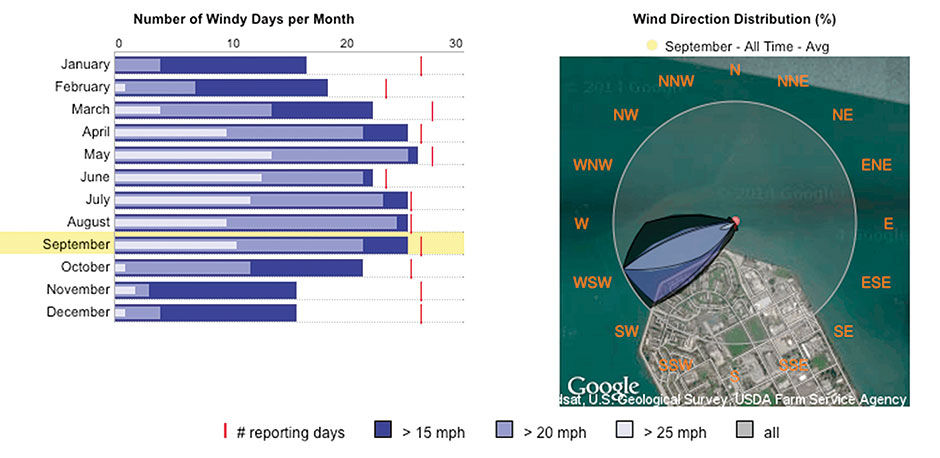
Figure 1.7: Iwindsurf.com: Historical statistics for wind speed and direction for Treasure Island.
This changed everything. We now have live, historical, and forecast wind data for every key site in the Bay Area, as well as precise and visualized tide levels and currents, in one place. In the adjacent discussion forum for Bay Area locals, a community has arisen that discusses everything from where they sailed that day to hidden underwater obstacles to debating the accuracy of a wind sensor in a particular wind direction. There is a marketplace of local used equipment for sale, and detailed directions and maps to favorite locations, with notes about local conditions, pitfalls, and wind sensor accuracy.
Since having iwindsurf, the proportion of days of showing up at a site and getting “skunked” – or not having enough wind to go out – have declined from 1 in 3 to 1 in 15. And because of the greater predictability of where and when to sail, I now belong to a group with three others who try to coordinate our trips. I’ve coined our group “The Pipe Jumpers” after our favorite place to launch from Treasure Island, near the center of the Bay. We are all fathers now, and three of us have two young children, so we have much less time to devote to personal pursuits. But thanks to a website that posts wind and tide conditions with bar charts and sine waves, we find better windsurfing conditions, plus have a new circle of friends and a broader community for sharing our experiences.
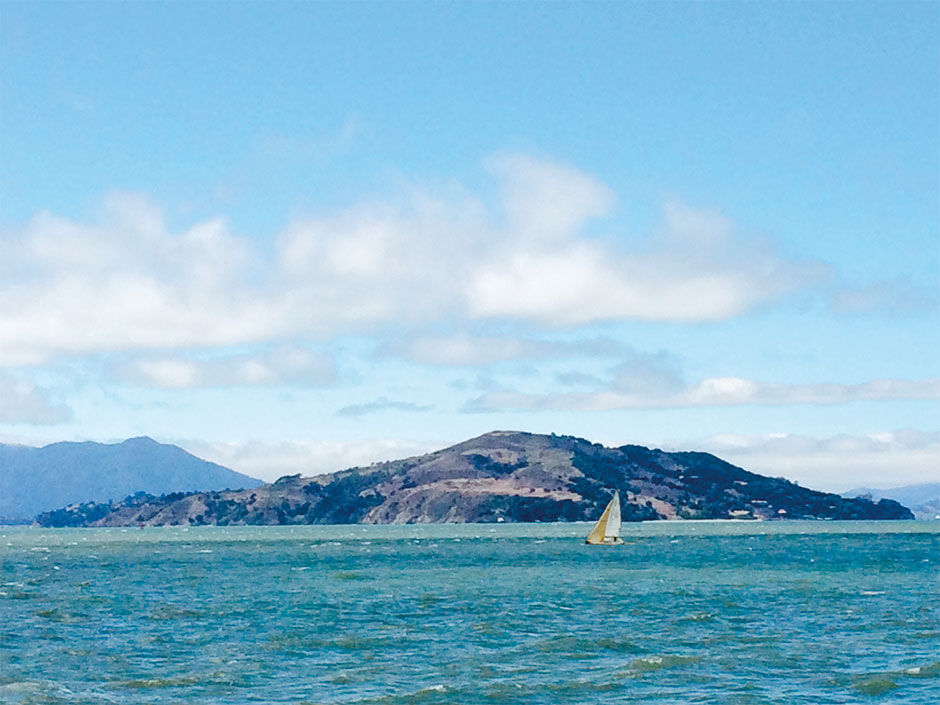
Figure 1.8: View of Angel Island, in San Francisco Bay, from Treasure Island.
Instead of enduring a guessing game of wasted time and gasoline, windsurfing is now surgical. Instead of clearing the entire afternoon to account for long drive times or waits on the beach, we monitor how the day develops with feeds updated every five minutes. When at the site, we check the current conditions with our smart phones so that we can rig the right gear. Having some or all four of us at the same location together has safety benefits, as it is always better to be out on the water with others in case of a breakdown or other emergency. Tom Gandesbery, one of the Jumpers, wears on his wrist a waterproof printed schedule of when the large ferries pass through our sailing area, so as to be in the right location to follow them and ride the particularly high waves in their wake. Immediately and later following a session, we review the record of wind and compare it to our experiences on the water. This allows us to better calibrate our board and sail combinations for similar conditions in the future, and share our conclusions with others.
I shared this experience mainly to provide an example of how the widespread recording and distribution of quantitative data, consumed via visual analytics on multiple computing devices, is impacting modern life and work. I paint such a detailed picture of the Bay Area windsurfing scene, in a book about analytics, to provide a use case in the non-traditional analytic application of recreation. I believe that similar cases are happening in other sports and activities. It’s a use case that I know intimately and a decision dynamic that comes close to those of personas in the workplace for whom I design products. Although I use visual analytics little if at all as a UX professional, I’ve spent great effort over the years to understand and anticipate the needs of those who do. I’ve interviewed, followed, and recorded travel agents, stockbrokers, corporate comptrollers, publication designers, retail salespeople, and TV watchers. While user-centered design research can tell you a lot about what motivates people at work, it’s common knowledge that the most effective way to understand those we design for is to somehow spend meaningful time experiencing their motivations, frustrations, risks, and rewards.
While I surely did not pursue windsurfing to get a better handle on using data as evidence for decisions, I’m a paying subscriber to a service that my cohorts and I check religiously six months out of the year. We use it to place small bets every Saturday and Sunday on whether, and how, to spend three to five precious hours away from our families (while we have all tried, our cold, wind-swept, and desolate launch sites are not pleasant for non-windsurfing partners, with or without kids). While far from the scale and impact of tasks like crafting a corporate investment strategy or reaching departmental staffing conclusions, the underlying process of making informed decisions, based on visually displayed quantitative evidence of current conditions, predictions, and performance over time, conducted under time pressure, is the same. I get similar insight when I’ve hired architects and other artisans to work on house projects. It’s a rare chance for me switch my typical role to that of a client sponsor for creative services and development. Not only must I resist the urge to dictate things, but also when it’s my money being spent I’m forced to experience investment and the associated risks from a different perspective.
1.0.1 Media Assets
L1.1 | TI Ferry Chase (video) | Tom Gandesbery | https://www.interaction-design.org/literature/book/bringing-numbers-to-life/assets
This is a video shot from a GoPro camera worn by Tom Gandesbery during a group windsurfing session on San Francisco Bay in July 2014.
1.0.2 References
1.1 | Iwindsurf (web) | http://wx.iwindsurf.com
