Not all data has dependencies or a linear structure. In fact some data is related by either or a combination of two properties: connection and containment. These data sets are considered to be networks.
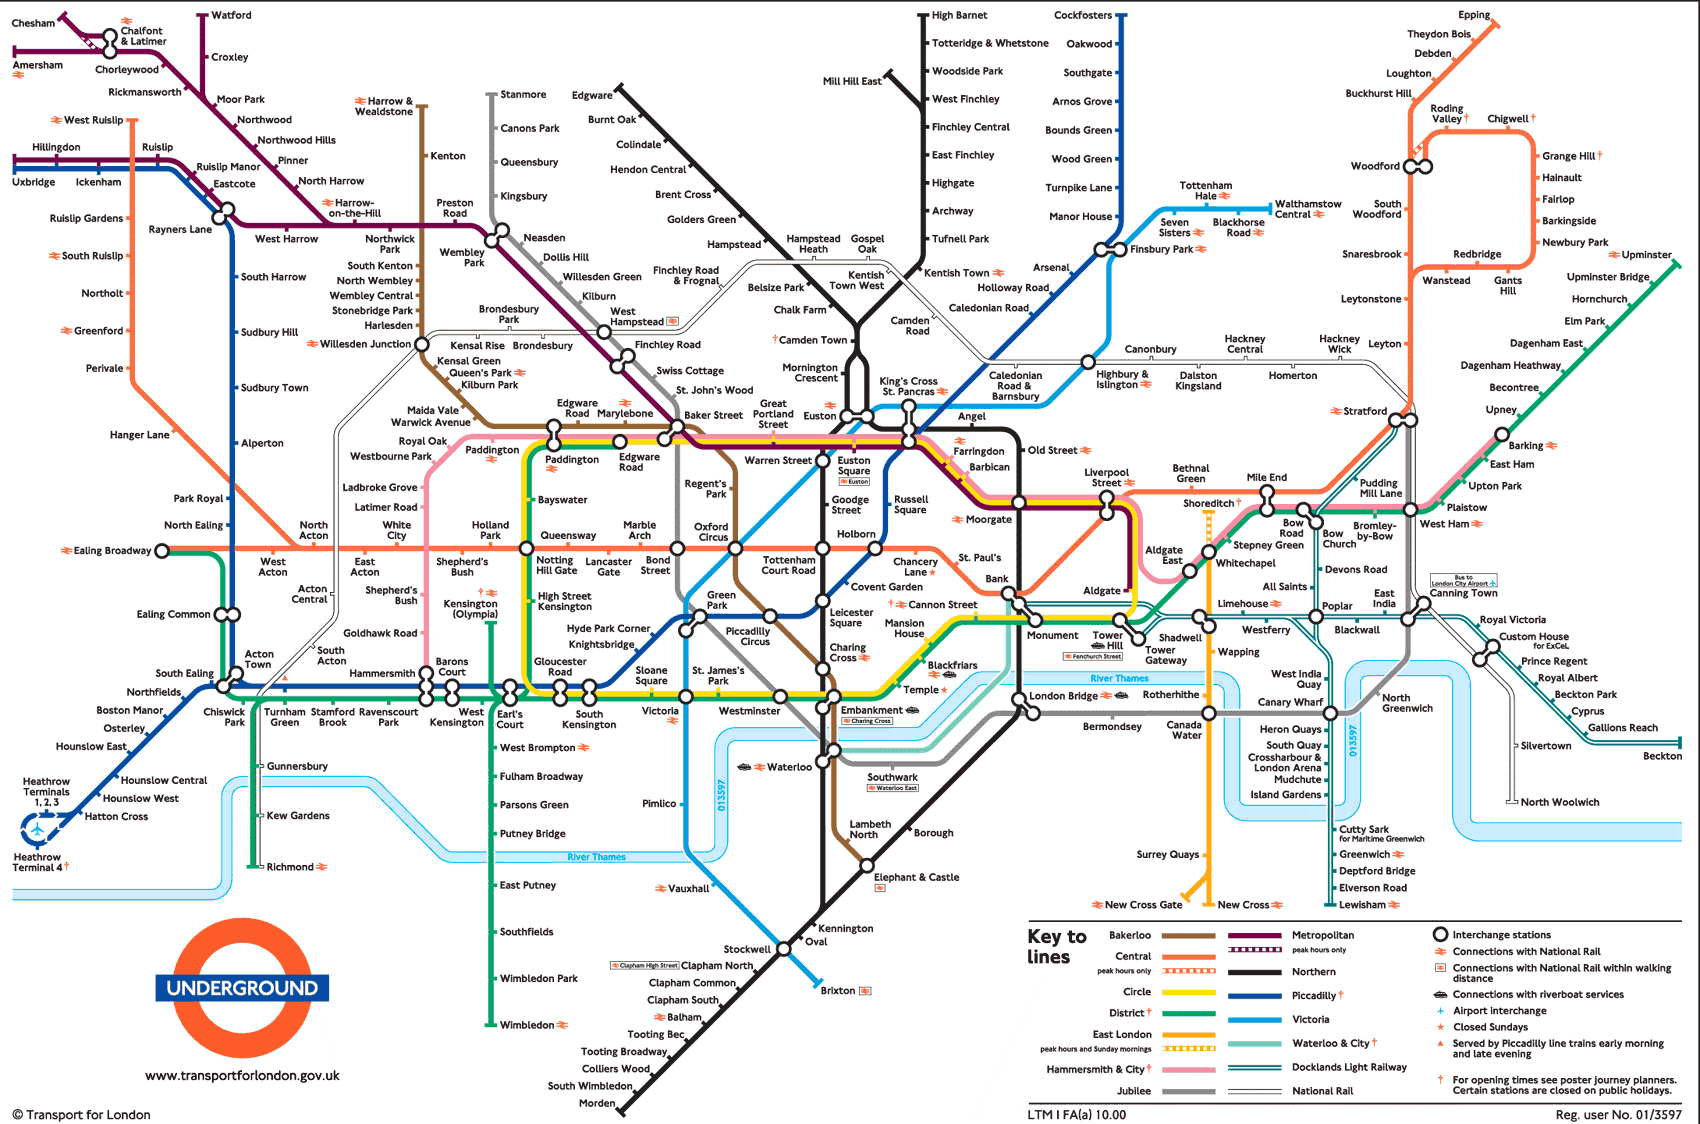
An easy example of a network is the London Underground Tube Network. Here the stations are either connected (via railway lines) or contained (either they are off the grid or not directly connected to each other). The classic London Underground tube map is a good example of information visualization for network data.
 Author/Copyright holder: Michael Moore. Copyright terms and licence: CC BY-SA 2.0
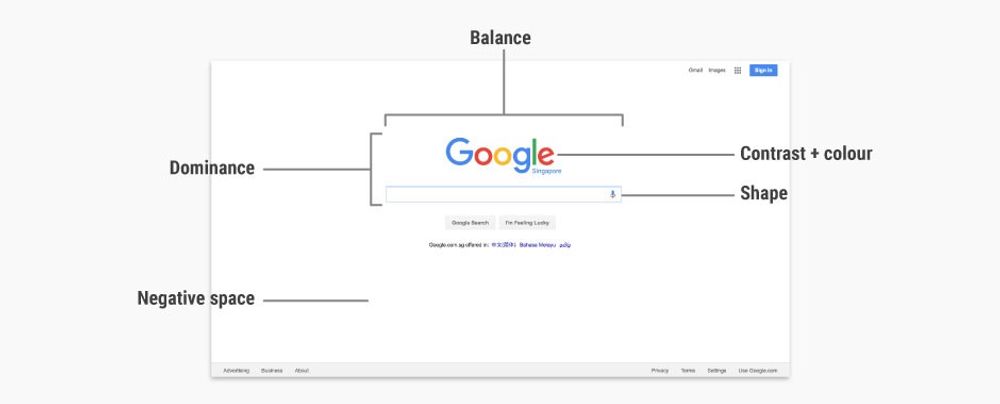
The Principles of Information Visualization for Network Data
In his book, “Introduction to Information Visualization” Riccardo Mazza offers four simple principles to consider when designing a network data information visualization:
The positions of the nodes
The representations of the edges
The dimensions involved
The interaction elements
Positioning of Nodes
A node is an entity of the network. It may be a physical entity (such as a station on the tube map) or an abstract entity (such as piece of data within a computer network). It doesn’t matter whether a node is physical or abstract but it does matter that a choice is made on how the nodes will be laid out within the representation. The shape, color, dimensions, etc. of nodes can also be used to convey additional information about each node if so desired.
Representation of Edges
Any relationship documented between nodes has to have an edge (commonly shown as a line or an arrow on basic network representations). It is possible for an edge to be indirect or direct and to have direction or no direction. It is also possible to give weight to an edge through the use of numbers, thickness of lines, colours or other visual techniques.
Dimensions Involved
Networks may contain extremely large datasets (think books in the British Library or the US Library of Congress, for example) and these cannot always be represented in neat graphs with simple one-to-one relationships. Considering the numbers of dimensions involved can help the designer solve how these more complex relationships can be conveyed in the information visualization.
Interaction Elements
If you are using software to create the network diagram – you may also have the option to enable users to create their own views within your visualization. It’s best to decide what level of interaction you intend to provide to add the most value to your users before you get bogged down in designing the visualization.
 Author/Copyright holder: Simon Pielow. Copyright terms and licence: CC BY-SA 2.0
2 Common Basic Network Diagrams
Let’s take a look at two fairly common basic network diagrams which use the first three principles well. Interaction elements tend to apply only to more complex information sets and as such aren’t a primary consideration here.
The Concept Map
Joseph Novak developed the concept map in the 1970s. They are simple representations showing relationships between concepts (nodes). They use labeled edges (known as propositions) which describe the connection between the two elements.
Concept maps enable the information visualization designer to take a simple concept and slowly extend it by adding further concepts and propositions. They can be very valuable in teaching and education because of this.
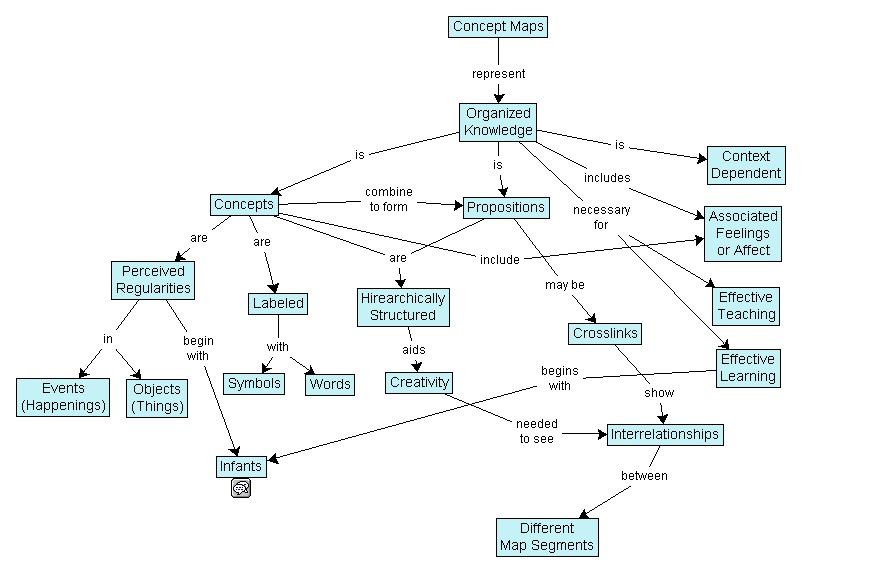 Author/Copyright holder: Vicwood40. Copyright terms and licence: CC BY-SA 3.0
The Mind Map
Tony Buzan, a researcher, developed the mind map concept. They serve a similar function to concept maps. The idea is to create concepts around a specific topic and then link them to each other with an edge describing the relationship.
Mind maps differ from concept maps in that they always work around a single central concept.
Tony Buzan offers many additional rules for developing mind maps in his book “The Mind Map Book”. These techniques are interesting and relate to the visual display of data within the mind map – they are not essential to understanding the mind map as a network diagram but are summarized in the image below.
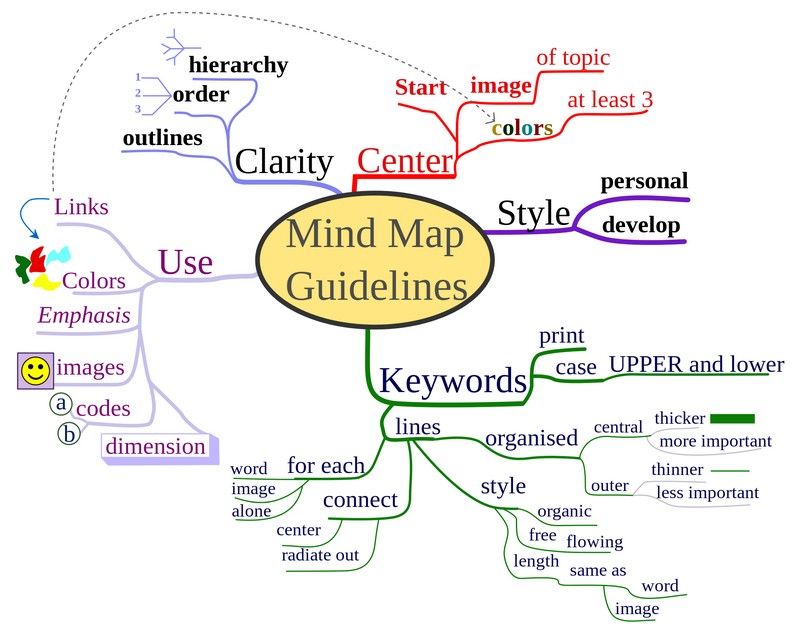
Author/Copyright holder: Nicoguaro. Copyright terms and licence: CC BY-SA 3.0
Tony says that using mind maps can help; “associate new and unique ideas with ‘old’ ideas that already exist to become exceptionally creative.”
The Take Away
It’s important to consider four factors before developing a basic network data visualization: The positions of nodes, the use of edges, the dimensions to be used and any interactions to be contained within the visualization.
Two common basic tools for representing networks are concept maps and mind maps.
References
Tony Buzan and Barry Buzan. The Mind Map Book. BBC Active, 2006.
Novak, J. D. (1990), Concept mapping: A useful tool for science education. J. Res. Sci. Teach., 27: 937–949. doi: 10.1002/tea.3660271003
More about Joseph Novak.
More about Tony Buzan.
Riccardo Mazza, Introduction to Information Visualization, Springer, ISBN 878-1-84800-219-7
Hero Image: Author/Copyright holder: Toby. Copyright terms and licence: CC BY-NC-ND 2.0