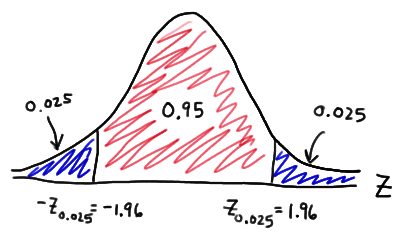
Every piece of UX research that we conduct will contain errors. Given that we know this, it’s relatively easy to calculate what’s known as a “confidence interval”.
So, for example, if we take a population of 50 people in a survey and 42 people do something in the same way – we can infer that between 71% and 91% of people will approach the task that way to a degree of 95% confidence.
But what does 95% confidence imply? Simply put, it just means that if you went to observe a population of 100 people, you’d expect to see that result 95 times and 5 times you’d expect it to happen differently.
Unfortunately, that leaves us with a bit of a problem – we don’t know if we’re measuring the 95% or the 5% in any given sample of 100 people. The purpose of a confidence interval is to help us manage risk and not to eliminate it entirely. If we are sure of the confidence interval; it lets us know how much weight we can put on the data.
Confidence and Statistics
You won’t be surprised to learn that it’s the science of statistics that allows us to calculate confidence levels. When we make statistical comparison we calculate a “p-value” and in general, it’s considered that if the p-value is lower than 5% then the result can be considered statistically significant.
That’s the same as our 95% confidence value and it’s why we chose 95% in the first example. However, achieving this level of confidence often requires a larger sample size than our research budgets allow. So what are the various confidence levels and which should we choose for what occasion?

Author/Copyright holder: Carriearchdale. Copyright terms and licence: CC BY-SA 3.0 Unported
Near Certainty (Confidence Value: 99% or greater)
There are industries in which close enough is simply not good enough. These are the industries in which products may kill or maim or expose companies to unacceptable levels of risk. Pharmacy is one industry like that. Autopilot manufacturers for planes would be another.
In these instances you need to be as close to 100% certain in your research as possible. That comes at a pretty hefty price-tag and takes a lot of time. Which is why new drug research, for example, can run at billions of dollars even after the new chemical has been identified and it can take years for that drug to come to market.
Publishable in Journals (Confidence Value: 95% of greater)
Journals are not as exacting as customers of pharmaceutical companies but nor do they tend to allow you to publish data without a very high-degree of certainty in its accuracy. The benchmark for most academic peer-reviewed journals tends to sit at 95% confidence in the results.
There are other industries which require this kind of accuracy too. Political polling organizations are expected to deliver this kind of accuracy; which explains why their sample sizes for polls tend to be in the hundreds or thousands.
Again, this kind of research takes time and is costly. In most cases, it’s simply too high a degree of certainty to be attained by a UX researcher except in very specific circumstances.

Author/Copyright holder: Mike Janssen. Copyright terms and licence: CC BY-NC 2.0
Good Enough to Make Commercial Decisions (Confidence Value: 90% or greater)
Much of corporate life is about compromises and the general compromise for companies engaged in UX research is that they like to be around 90% certain that results are valid before they base major user-facing decisions on them.
For small UX teams or solo researchers – this can be a big challenge, to reach this degree of confidence and it requires a lot of attention to detail in research design. The payoff is that it becomes harder to blame the UX team if something goes wrong – there’s a 10% chance that whatever your research results show that they weren’t correct.
Good Enough to Justify More Research/Development (Confidence Value: 80% or greater)
If we had to wait for 90% certainty in all our research – it would still take too long to develop products. So before they are pushed in front of users, most business will accept a lower level of certainty, usually around the 80% mark.
That’s a 4 in 5 chance of being right and makes it worth pursuing a research or development avenue. It’s also much cheaper and easier to achieve and can be done with relatively small sample sizes (of course this varies depending on technique selected and the size of the user pool).
If getting it wrong won’t cost a fortune or destroy a company’s reputation – this can be a healthy place to conduct most of your research. It allows for rapid iteration and ideation without descending into a guessing game about user needs either.
Better Than Tossing a Coin (Confidence Value: 51% or greater)
Sometimes a decision really isn’t that important. If you’re discussing a feature that only a tiny percentage of the user base uses and that the risks of a mistake causing any major problems are approaching zero – then a confidence value of 51% or more is still better than tossing a coin to make the decision.
Now, most of the time – this is a poor approach to decision making but occasionally it’s useful for breaking a deadlock and letting you move onto something more valuable in your UX research. Don’t depend on mid-range confidence values but they aren’t completely without usefulness either.

Author/Copyright holder: jessica wilson {jek in the box}. Copyright terms and licence: CC BY-NC-ND 2.0
Summary
Confidence values matter in research. They guide the research as to how much weight the research should carry in the decision making process. A confidence value of less than 50% is worthless – it’s less likely to be right than flipping a coin. From there on in, it’s a question of the higher the confidence – the more likely you are to have struck gold.
Research should be designed with confidence values in mind and results reported with confidence values clearly stated. This enables a rational approach to decision making and does not expose the researcher to high-levels of career risk if things should go wrong.
Header Image: Author/Copyright holder: Penn State. Copyright terms and licence: All rights reserved. Img


