Designing information visualizations offers you endless possibilities when it comes to end products, and it would be impossible to provide step-by-step instructions for all these possibilities. However, it is fair to say that while the end products may vary dramatically – the process by which we reach the best possible end product is consistently the same.
Author/Copyright holder: Kitware Inc. Copyright terms and license: CC BY-ND 2.0
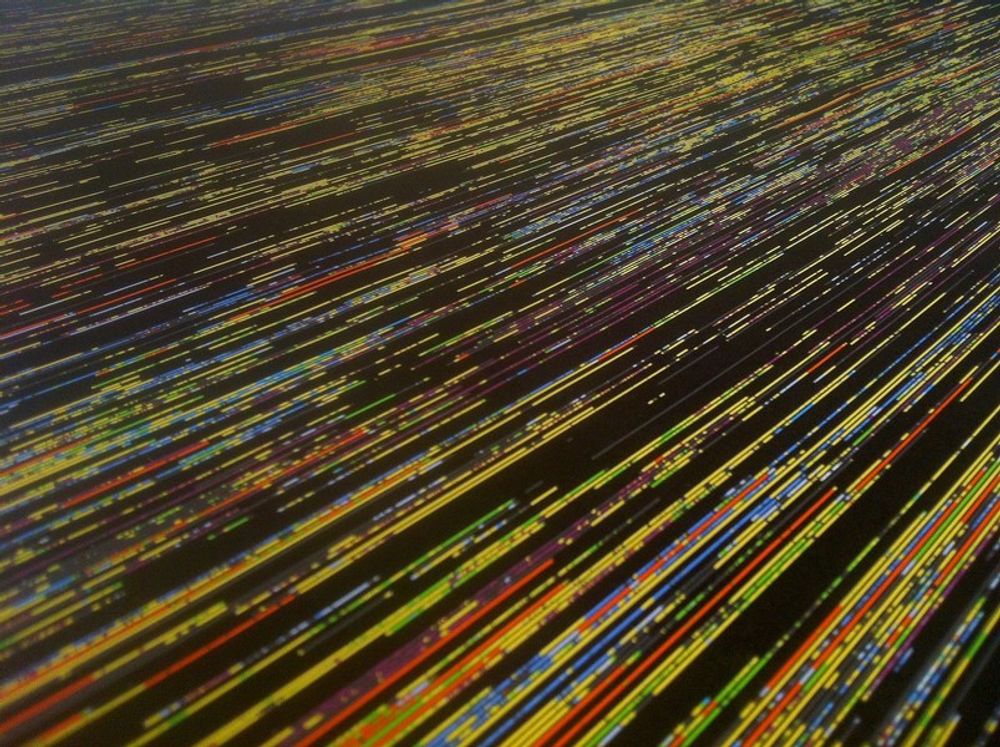
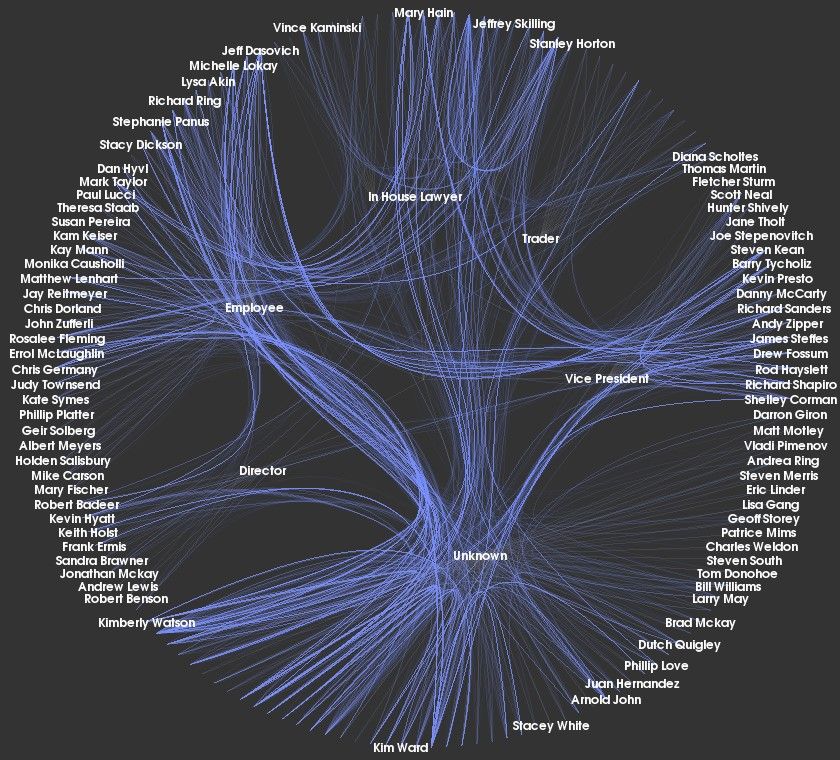
As you can see, information visualization can lead to incredibly beautiful images as well as conveying information. The image above is the organization of the now-defunct Enron group’s communications.
It is important to keep in mind what Ben Shneiderman said; “The purpose of visualization is insight, not pictures.”
In his book, “Introduction to Information Visualization” Riccardo Mazza offers a simple and straightforward 5-step process to follow when designing information visualizations:
5 Steps to Designing an Information Visualization
The overall process is simple, and once you’ve reviewed the process, it should feel like common sense:
Define the problem.
Define the data to be represented.
Define the dimensions required to represent the data.
Define the structures of the data.
Define the interaction required from the visualization.
1. Define the Problem
As with any user experience work, the first step is to define the problem that your information visualization will solve. This will usually require user research to answer these questions: “What does my user need from this?” and “How will they work with it?”
You may be trying to explain something to a user, or you may be trying to enable them to make new connections or observations; it might even be that the user is trying to prove a theory.
You should also take into account any specific factors that are unique to the user base during this research. What is their level of education or ability with data handling? What kind of experience do they have with the data in the past? This will guide the level of complexity of the output and clarify the overall needs of the user.
2. Define the Data to be Represented
There are three main types of data that can be represented through information visualization, and the way that they are mapped can vary dramatically – so it pays to have it clear in your mind before you start designing what data you will use.
Quantitative data – data which is numerical
Ordinal data – data that doesn’t have numbers but does have an intrinsic form of order (days of the week, for example)
Categorical data – data which has neither numbers nor intrinsic order (such as business names or place names)
3. Define the Dimensions Required to Represent the Data
The number of dimensions or attributes of a data set must be considered carefully as it will determine, to a great extent, the possible information visualizations that can be used to represent the data.
The more dimensions represented in the data – the more confusing it can be to comprehend the information visualization. Thus, it’s worth noting that the data with large numbers of dimensions may well benefit from using a highly interactive representation rather than a static one.
Four types of analysis can be conducted based on the number of variables to be studied:
Univariate analysis – where a single variable is studied
Bivariate analysis – where two variables are studied
Trivariate analysis – where three dependent variables are studied
Multivariate analysis – a general term for more than one variable being studied
Each variable represents a dimension, which can be dependent or independent of each other. The most common example is a two-dimensional (bivariate) analysis. This is traditionally shown with the independent variable along the horizontal (X) axis and the dependent along the vertical (Y). Naturally, this gets much more complex with increasing dimensions, as the diagram below demonstrates.
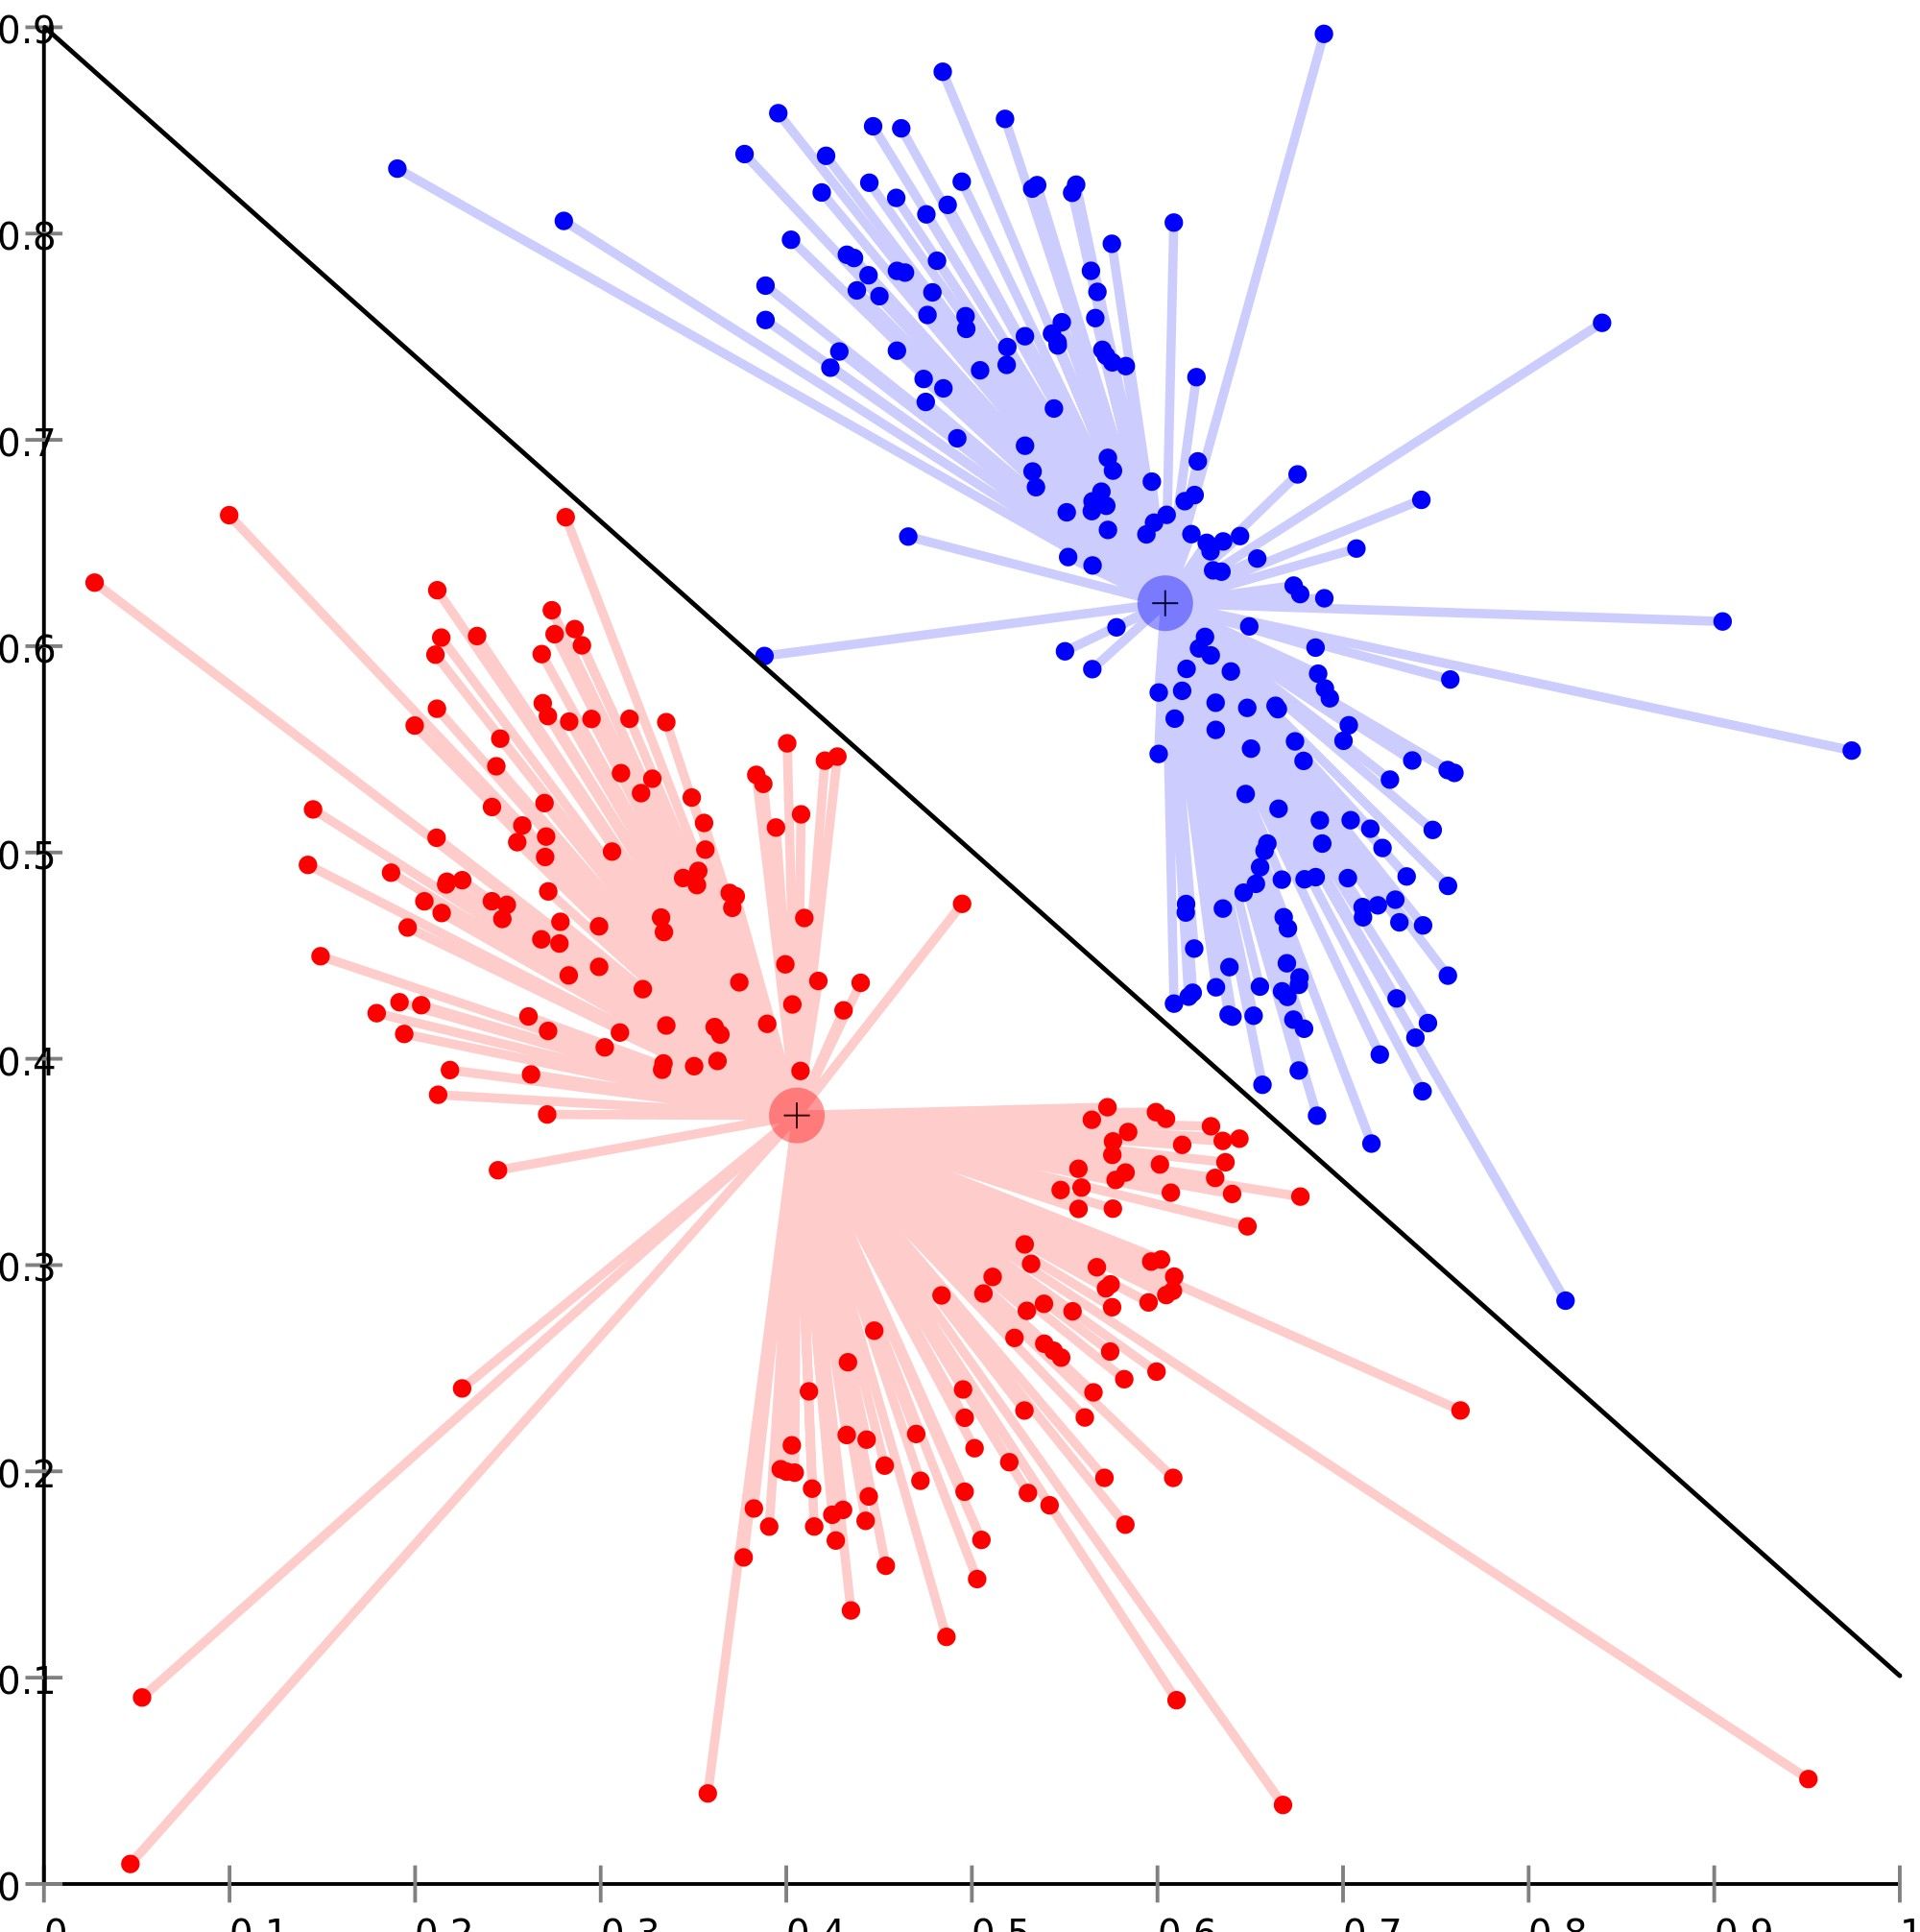
Author/Copyright holder: Chire. Copyright terms and license: CC BY-SA 3.0
An image of multivariate analysis where relationships between data points are numerous and dependent.
4. Define the Structures of the Data
This is all about examining how the data sets will relate to each other. Common relationship structures include:
Linear relationships – where data can be shown in linear formats such as tables, vectors, etc.
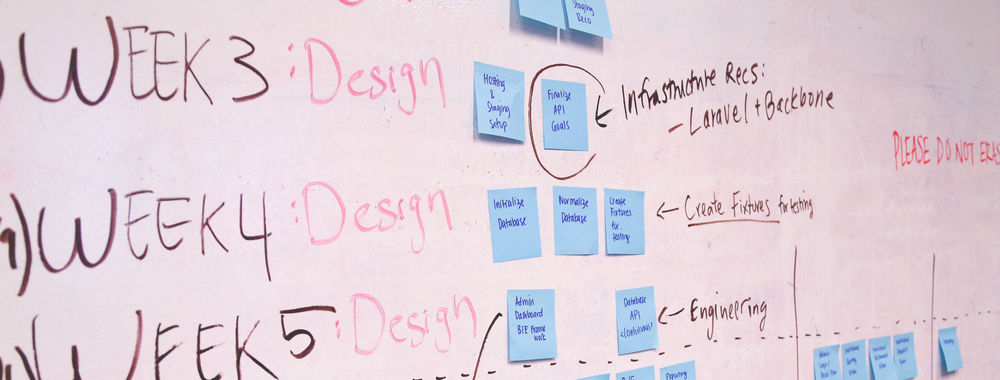
Temporal relationships – where data changes over the passage of time
Spatial relationships – data that relates to the real world (such as map data or an office floor plan); this is sometimes also known as a geographical relationship
Hierarchical relationships – data that relates to positions in a defined hierarchy (from an office management structure to a simple flowchart)
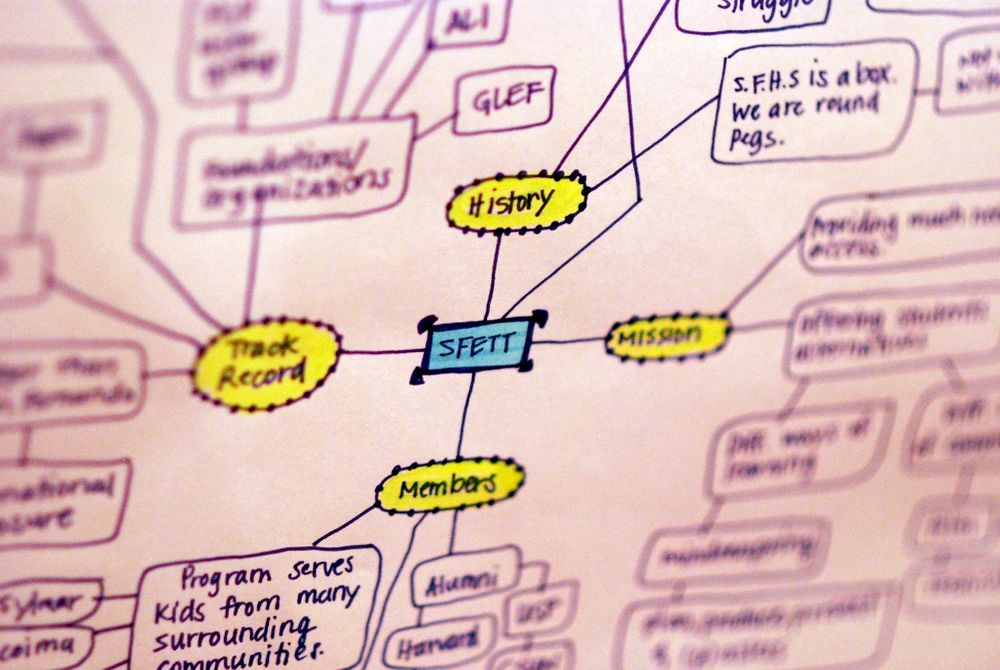
Networked relationships – where the data relates to other entities within the same data
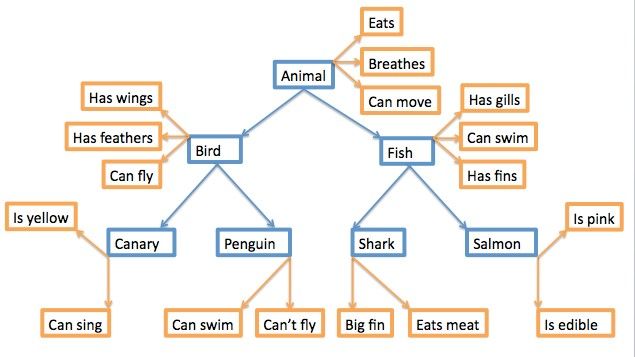
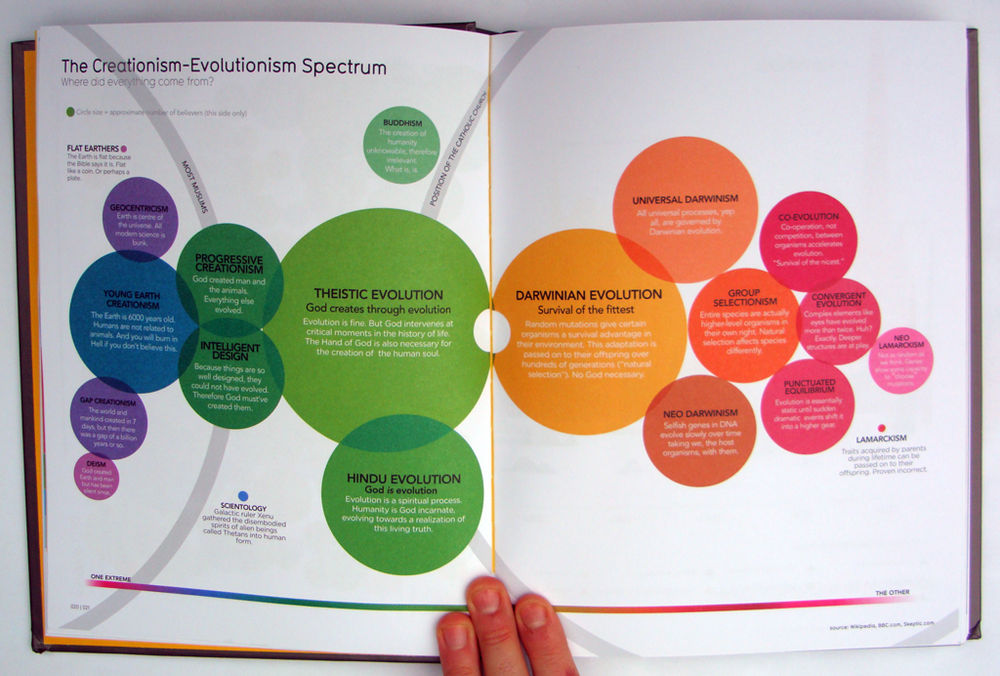
Author/Copyright holder: Nathanael Crawford. Copyright terms and license: CC BY-SA 3.0
An example of a hierarchical network model is shown above.
5. Define the Interaction Required from the Visualization
The final part of the design process requires that you understand the level of interaction required from the information visualization by the user. There are three categories of interaction:
Static models – these models are presented “as is” such as maps in a Road Atlas that you keep in a car. They cannot be modified by the user.
Transformable models – these models enable the user to transform or modify data. They may allow the user to vary parameters for analysis or choose a different form of visual mapping for the data set.
Manipulable models – these models give the user control over the generation of views. For example, they may allow a user to zoom in or zoom out on a model or to rotate 3-dimensional models in space for viewing from other angles.
It’s worth noting that you can combine transformable and manipulable models to create the highest level of interaction in information visualization.
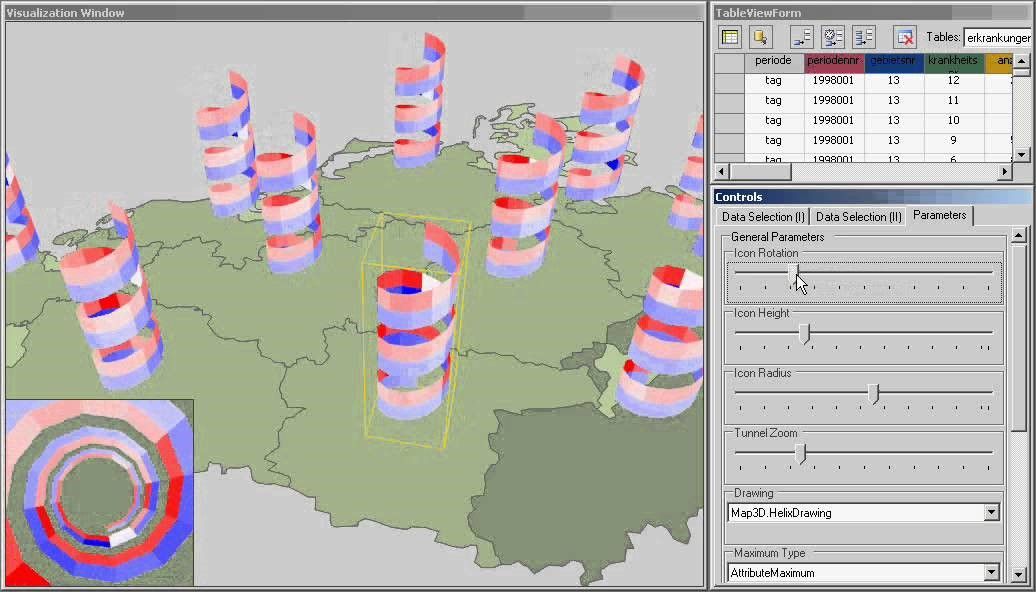
As models become more complicated, as above, it can be useful to be able to interact with those models to get to specific data.
The Take Away
This process of how to design an information visualization is not concerned with your final output but rather enabling you to make an informed decision on what forms of representation might best serve your users. By understanding a user’s needs, the data to be displayed and the relationships in that data as well as the kind of model required, the information visualization designer can deliver a model which meets those needs.
References & Where to Learn More:
Course: Information Visualization
Riccardo Mazza, Introduction to Information Visualization, Springer, ISBN 878-1-84800-219-7
Orana Velarde, These 21 Tools to Create Infographics Will Save You Tons of Time (And Your Infographics Will Be Stunning), 2019.
Shneiderman Quote: from Readings in Information Visualization: Using Vision to Think.
Hero Image: Author/Copyright holder: Christian Guthier. Copyright terms and license: CC BY-SA 2.0