Data has been said to be the new world’s currency and the web can be seen as the exchange where this currency is traded. In our everyday lives we have thousands if not millions of pieces of data thrown at us every day. As designers we need to sit down and work out how we are going to communicate this data to our clients or the general public, making it stand out from the crowd. The best and easiest to communicate method to display data is through data visualisation.
There are a number of data visualisation tools readily available of today’s market. Most of which nowadays require basic point and click interfaces that require very minimal coding knowledge. These powerful pieces of software can make your life allot easier and give you a great reputation at minimal time expense.
We have checked out a couple of options in our roundup below.
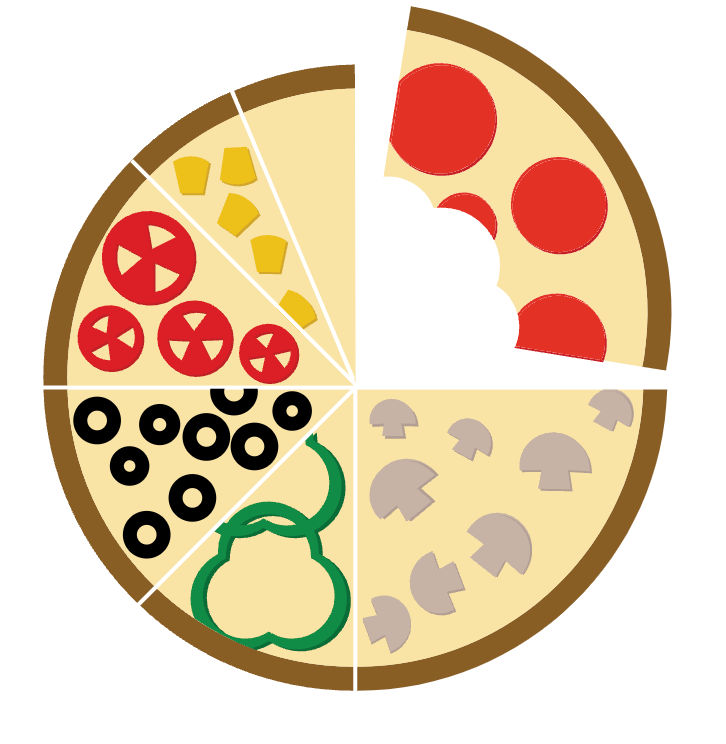
Pizza pie charts by Zurb is a fantastic piece of software which is based on a framework of SVG’s with its primary focus on HTML and CSS making it super easy to integrate instead of using JavaScript objects as well as being responsive.You can get it here!
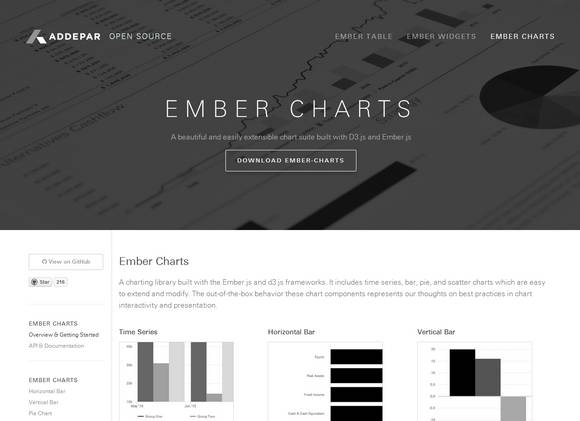
Ember charts is a library built with Ember.js and D3.js. It includes a number of elements which are super easy to modify and extend. You can download it via github here.
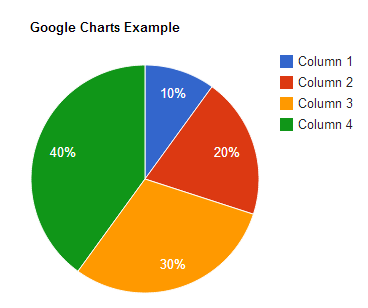
Google charts is a great tool as with the rest of their product offering, they provide a super simple, easy to use way to display data on your website using simple elements and built in animation along with user interaction controls. You can get ithere.
Cube is an open source platform for visualising data. Great for internal dashboards as you can build real time visualisations of metrics for internal dashboards such as monitoring traffic on your platform. Pick it up here.
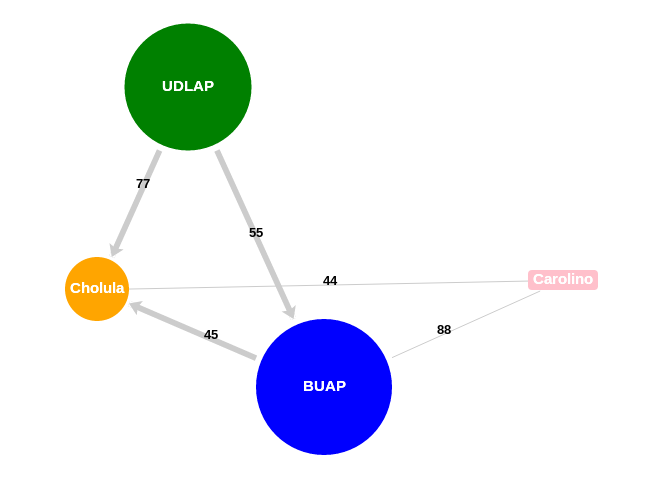
Arbor.js is a graph visualisation library built on jquery and can be used with canvas and svg and doesn’t force methods for screen drawing. The arbor.js file makes it super easy to focus on creating graph data and styling it rather than delving into the physics side to make it all work. Download ithere.
Header Image: Author/Copyright holder: Unknown. Copyright terms and licence: Unknown. Img
Image credits:
Cube: http://square.github.io/cube/
Arbor: Imgur.com
Google Charts: http://girlfromoutofthisworld.com/
Ember: http://maxcdn.webappers.com/