Jesse James Garrett, the information designer, says; "What makes people passionate, pure and simple, is great experiences. If they have great experience with your product and they have great experiences with your service, they’re going to be passionate about your brand, they’re going to be committed to it. That’s how you build that kind of commitment."
In order to make people passionate, though, you have to understand who they are. If you want an information visualization to deliver maximum value – you have to know your user. You can only gain deep insight into your users through user research but there are two generic categories of user for information visualizations with two different sets of requirements: information consumers and information analysts.
Information Consumers
Everyone is, at some point in time, an information consumer. An information consumer needs to be informed of something interesting from underlying data. They may need the information to make a decision or they may need it just for the sake of education. They don’t want or need to work for the information – they expect the information visualization to deliver understanding.
Conversely, the information consumer may also need to be persuaded by information visualization design to make a specific choice in the interests of the designer or the business which they represent. Information visualizations aimed at consumers thus either have the intent to inform or to persuade.
Common Forms of Information Visualization for Information Consumers
Sir Arthur Conan Doyle, the author of the famous detective series Sherlock Holmes said; “I never guess. It is a capital mistake to theorize before one has data. Insensibly one begins to twist facts to suit theories, instead of theories to suit facts.”
The purpose of information visualization for consumers is to provide them with data so that they don’t have to guess. While consumers of information can, and often do, find standard graphs and statistical devices useful there is a very common way of providing data to consumers in a way that is not overwhelming – the infographic.
Infographics
An infographic can be a combination of imagery, graphical data and text and its purpose is to make data easily (and often enjoyably) understood at a glance or with a brief amount of attention.
Classical graphs, such as bar charts, Gantt charts, histograms, etc. can all be considered to be infographics but in the mind of the modern consumer of data – the infographic is something similar to that pictured below.
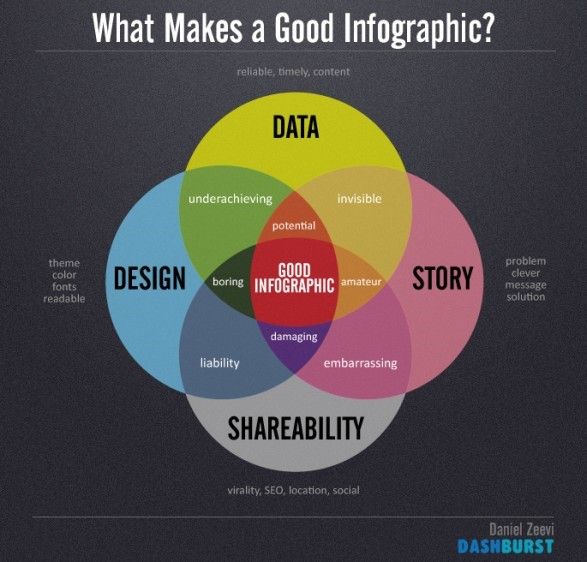
Author/Copyright holder: Dash Burst. Copyright terms and licence: All rights reserved.
Infographics are generally conceived to convey a specific message. In our example it is “What makes a good infographic” but it might as easily be “What information visualization matters” or “Choosing the perfect color for a car.”
Good infographics are accurate. In that they contain reliably sourced information. However, when using infographics to persuade – data may be poorly (if at all) sourced and unreliable. Smart information consumers will evaluate an infographic for reliability but sadly, many information consumers will not. This is why your Facebook feed (over time) fills up with nonsense purporting to be fact.
Data Journalism
Another common form of information visualization for information consumers is found in data journalism. It is used to bring together different concepts and unite them visually. It’s worth noting that data journalism does not have to use information visualization, by its definition, however it is incredibly common to present data visually in data journalism.
The process of data journalism and where visualization fits into it is detailed below:
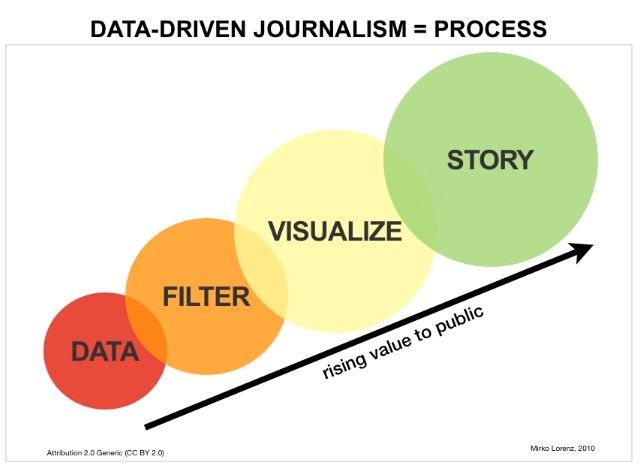
Author/Copyright holder: Mirkolorenz. Copyright terms and licence: CC BY-SA 3.0
The Guardian newspaper offers an irregular column dedicated to data journalism and statistical expression in visualization which can be found at - http://www.theguardian.com/media/data-journalism
Information Analysts
Information analysts also use information visualizations and just like information consumers they may use these visualizations to confirm their understanding of ideas and concepts.
 Author/Copyright holder: GDS Infographics. Copyright terms and licence: CC BY 2.0
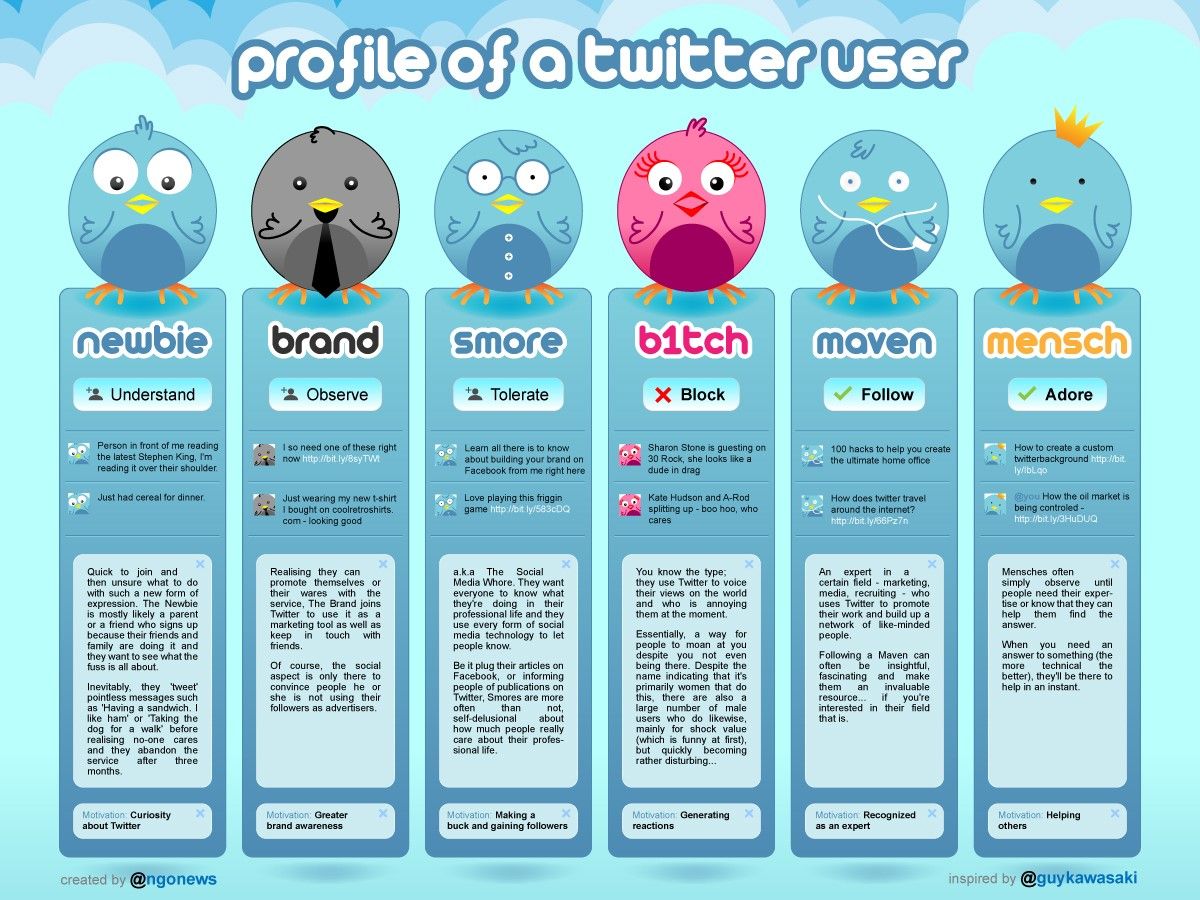
For example a social media information analyst might find the infographic above useful for confirming their understanding of typical Twitter users before continuing to explore Twitter relationships in more depth.
However, more commonly an information analyst will use data information visualization techniques not to confirm what they already know but rather to investigate what it is that they don’t know. The visualizations they use may help them avoid obvious conclusions by showing contradictory evidence to those conclusions or they may help them become more cautious of accepting coincidence as an established factual relationship.
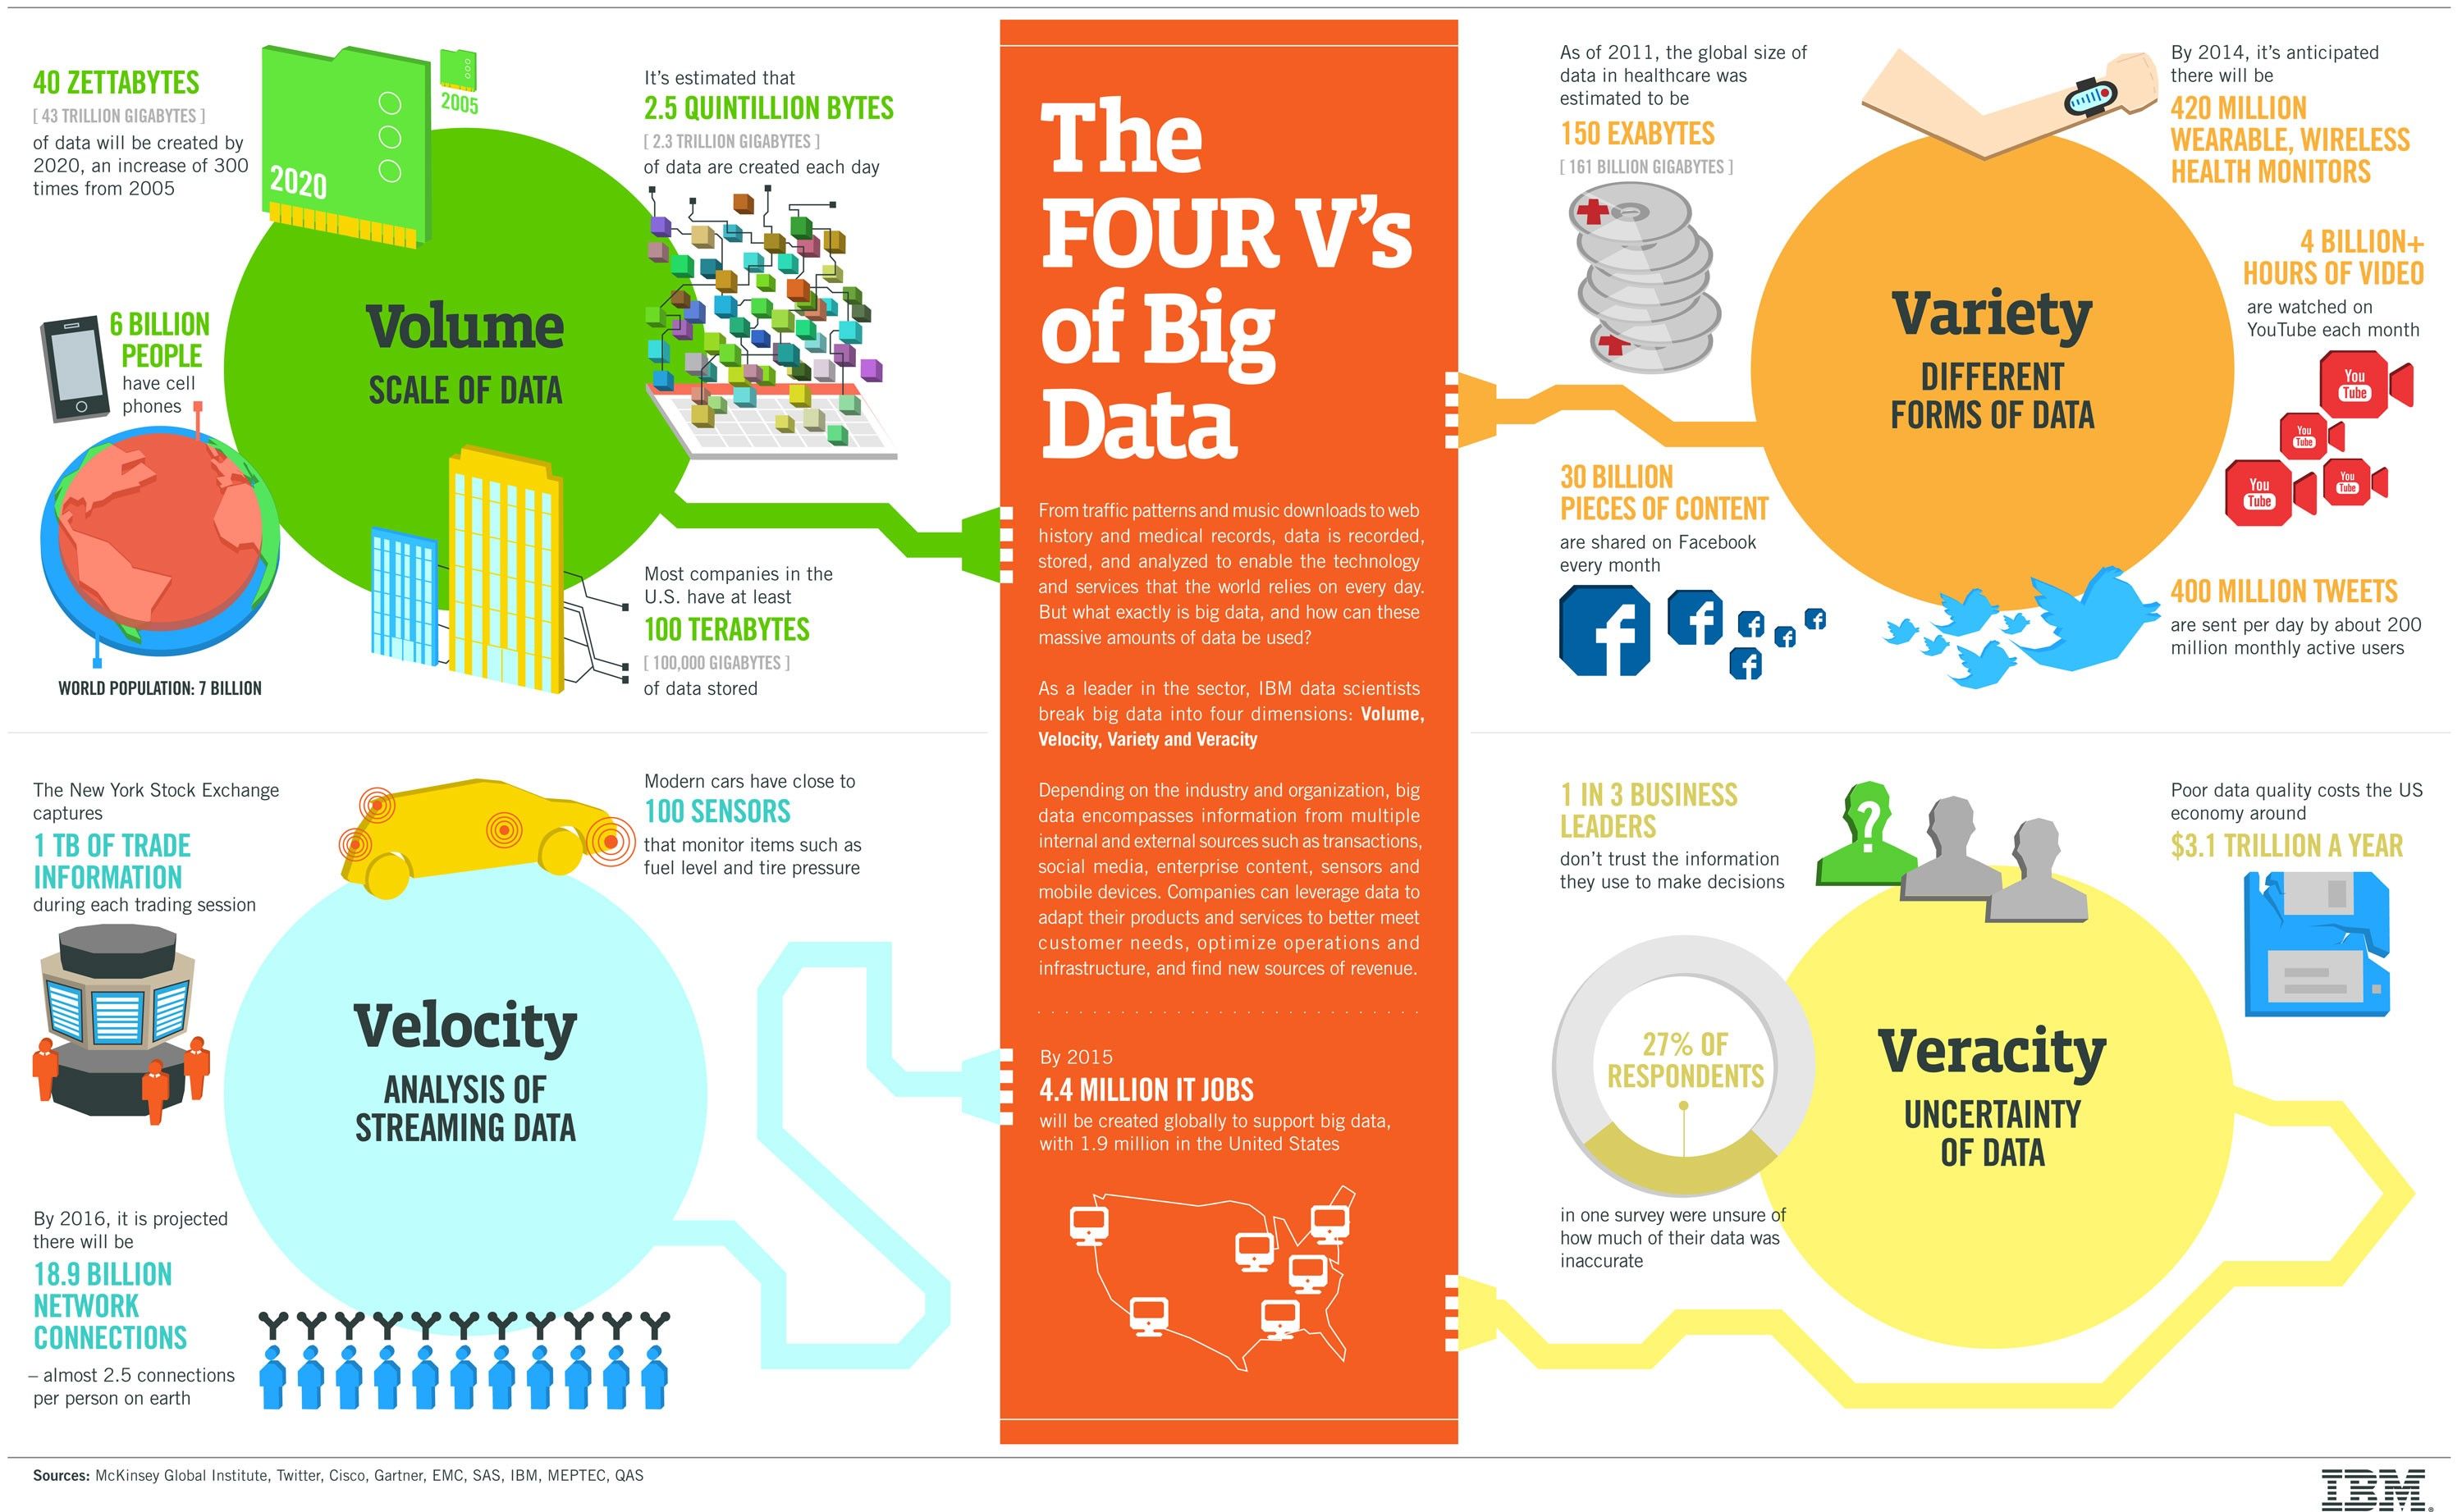
Information analysts, more than information consumers, are more likely to need information visualizations with which they can interact. By being able to alter the views of data sets and being able to make adjustments, on the fly, to data sets – they are likely to be able to examine data more thoroughly through information visualization. This is particularly true for information analysts involved in “big data” projects. Big data is a term which refers to incredibly large data sets held within computer systems and on the Internet. These data sets cannot, generally, be represented easily through traditional static forms of information visualization.
 Author/Copyright holder: Olivier Carré-Delisle. Copyright terms and licence: CC BY-ND 2.0
Big data is easily explained through the use of another infographic, this time from IBM.
The Take Away
If we understand how the information will be used, we can create better information visualizations for our end users. Information visualization designers should not see the general categories of information consumer and information analyst provided in this article as an end point but rather a beginning to inform their user research which will establish the uses for the data and the user’s actual requirements for their information visualizations.
References & Where to Learn More:
Find out more about Jesse James Garrett.
Find infographics about infographics here.
Hero Image: Author/Copyright holder: Lauren Manning. Copyright terms and licence: CC BY 2.0