7. Bifocal Display

416 shares
Download PDF

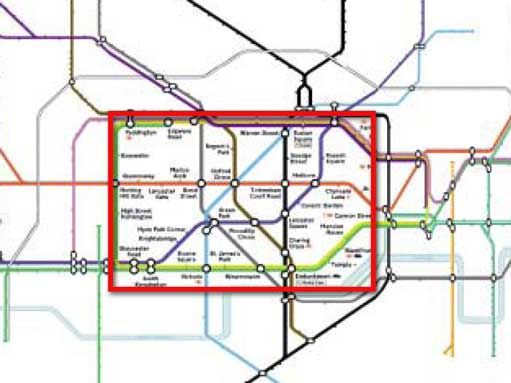
The Bifocal Display is an information presentation technique which allows a large data space to be viewed as a whole, while simultaneously a portion is seen in full detail. The detail is seen in the context of the overview, with continuity across the boundaries, rather than existing in a disjoint window (see Figure 1).

A bifocal representation of the London Underground map, showing the central area in full detail, while retaining the context of the entire network. It is important to note the continuity of the lines

Author/Copyright holder: Robert Spence and Prentice Hall. Copyright terms and licence: All Rights Reserved. Reproduced with permission. See section "Exceptions" in thecopyright terms below.

Figure 7.1: A bifocal representation of the London Underground map, showing the central area in full detail, while retaining the context of the entire network. It is important to note the continuity of the lines between the focus and context regions, in spite of the differing magnification factors

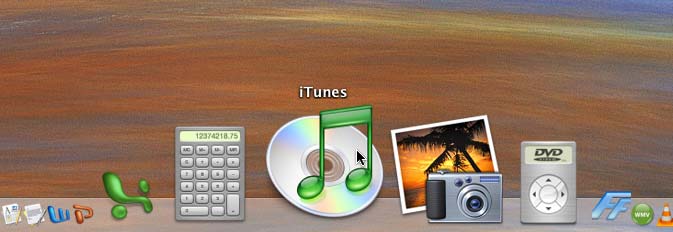
William Farrand's (Farrand 1973) observation that "an effective transformation [of data] must somehow maintain global awareness while providing detail" reflected a longstanding concern, both with a user's need to be aware of context and with the "too much data, too small a screen" problem. Although static solutions already existed in the field of geography, an interactively controlled transformation that satisfied Farrand's requirement and, moreover, maintained a continuity of information space, was invented in 1980 by Robert Spence (Imperial College London) and Mark Apperley (University of Waikato, New Zealand), who gave it the name 'Bifocal Display'. Since then it has been implemented, generalized, evaluated and widely applied. Today there are many applications of the Bifocal Display concept in use; for example the very familiar stretchable dock of application icons associated with the Mac OSX (Modine 2008) operating system (Figure 2).

The very familiar example of the bifocal concept; the Macintosh OSX application 'dock', released in 2001

Author/Copyright holder: Apple Computer, Inc. Copyright terms and licence: All Rights Reserved. Used without permission under the Fair Use Doctrine (as permission could not be obtained). See the "Exceptions" section (and subsection "allRightsReserved-UsedWithoutPermission") on the pagecopyright notice.

Figure 7.2: The very familiar example of the bifocal concept; the Macintosh OSX application 'dock', released in 2001

Author/Copyright holder: Courtesy of Rikke Friis Dam and Mads Soegaard. Copyright terms and licence: CC-Att-ND (Creative Commons Attribution-NoDerivs 3.0 Unported).

Introduction to the Bifocal Display

Author/Copyright holder: Courtesy of Rikke Friis Dam and Mads Soegaard. Copyright terms and licence: CC-Att-ND (Creative Commons Attribution-NoDerivs 3.0 Unported).

Main guidelines and future directions

Author/Copyright holder: Courtesy of Rikke Friis Dam and Mads Soegaard. Copyright terms and licence: CC-Att-ND (Creative Commons Attribution-NoDerivs 3.0 Unported).

How the Bifocal Display was invented and launched

Author/Copyright holder: Mark Apperley and Robert Spence. Copyright terms and licence: All Rights Reserved. Reproduced with permission. See section "Exceptions" in the copyright terms below.

The Bifocal Display concept video from 1980

7.1 The Bifocal Display Explained

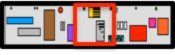
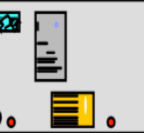
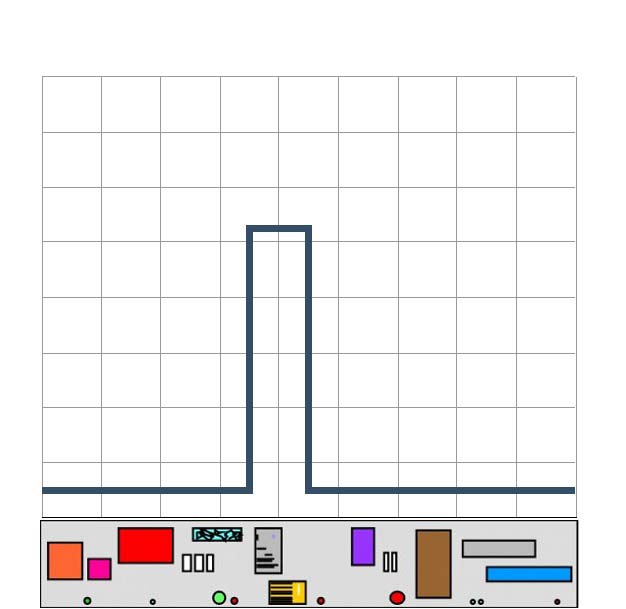
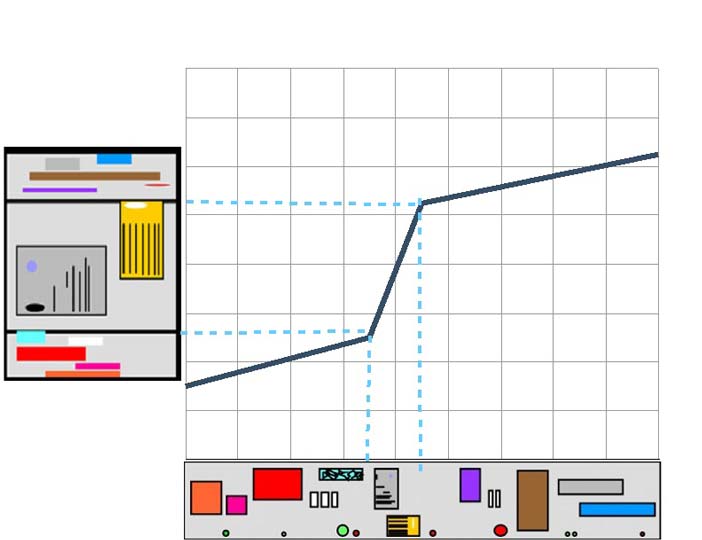
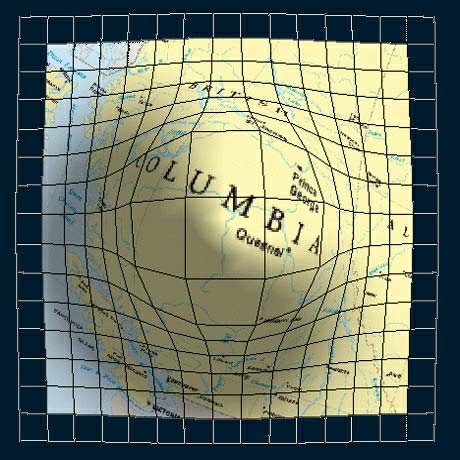
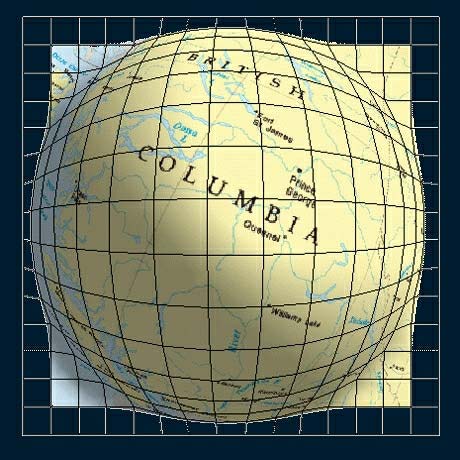
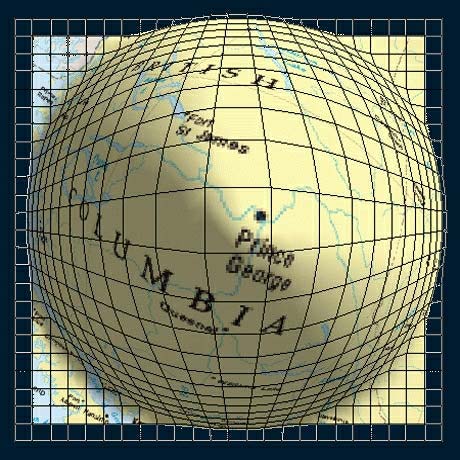
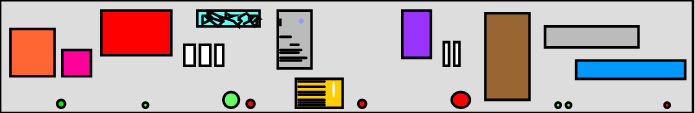
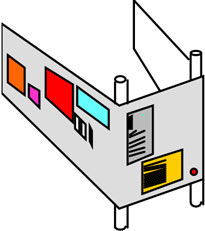
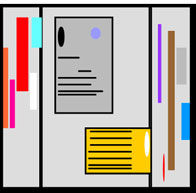
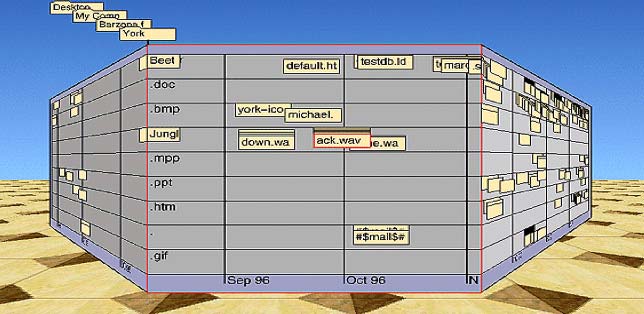
The concept of the Bifocal display can be illustrated by the physical analogy shown in Figures 3, 4, and 5. In Figure 3 we see a sheet representing an information space containing many items: documents, sketches, emails and manuscripts are some examples. As presented in Figure 3 the information space may be too large to be viewed in its entirety through a window, and scrolling would be needed to examine all information items. However, if the sheet representing the information space is wrapped around two uprights, as in Figure 4, and its extremities angled appropriately, a user will see Figure 5 part of the information space in its original detail and, in addition, a 'squashed' view of the remainder of the information space. The squashed view may not allow detail to be discerned but, with appropriate encoding (e.g., colour, vertical position) both the presence and the nature of items outside the focus region can be interpreted. If an item is noticed in the context region and considered to be potentially of interest, the whole information space can be scrolled by hand to bring that item into detail in the focus region.

Figures 3, 4, and 5 emphasises that the 'stretching' or 'distorting' of information space is central to the concept of the Bifocal Display. The continuity of information space between focus and context regions is a vital feature and especially valuable in the context of map representation (see below).

An information space containing documents, email, etc.

Author/Copyright holder: Courtesy of Mark D. Apperley and Robert Spence. Copyright terms and licence: CC-Att-ND-3 (Creative Commons Attribution-NoDerivs 3.0 Unported).

Figure 7.3: An information space containing documents, email, etc.

The same space wrapped around two uprights

Author/Copyright holder: Courtesy of Mark D. Apperley and Robert Spence. Copyright terms and licence: CC-Att-ND-3 (Creative Commons Attribution-NoDerivs 3.0 Unported).

Figure 7.4: The same space wrapped around two uprights

Appearance of the information space when viewed from an appropriate direction

Author/Copyright holder: Courtesy of Mark D. Apperley and Robert Spence. Copyright terms and licence: CC-Att-ND-3 (Creative Commons Attribution-NoDerivs 3.0 Unported).

Figure 7.5: Appearance of the information space when viewed from an appropriate direction

Immediately following its invention in 1980, the Bifocal Display concept was illustrated in a press release based on an (the first!) envisionment video (Apperley and Spence 1980) showing it in use in the scenario of a futuristic office. It was presented to experts in office automation in 1981 (Apperley and Spence 1981a; Apperley and Spence 1981b;) and the technical details (Apperley et al. 1982) of a potential implementation were discussed in 1982, the same year that a formal journal paper (Spence and Apperley 1982) describing the Bifocal display was published.

A number of significant features of the Bifocal display can be identified:

7.1.1 Continuity

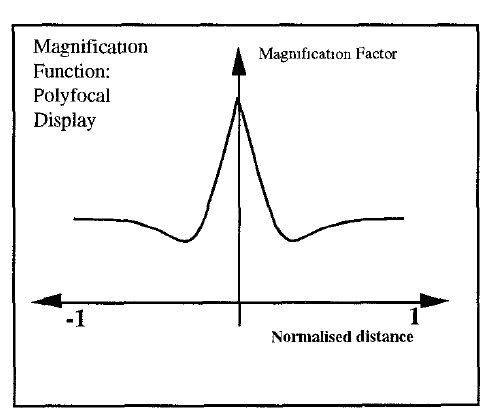
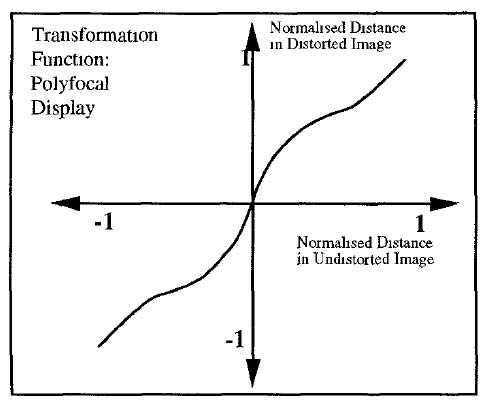
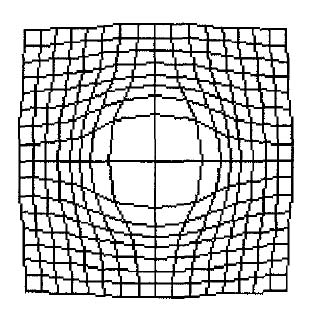
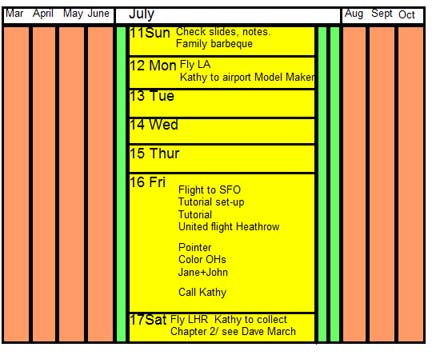
Continuity between the focus and context regions in a bifocal representation is an important and powerful feature, facilitated by the notion of 'stretching' or 'distorting' the information space. Formally, the transformation of the space must be monotonic (effectively, moving in the same direction) in both dimensions for continuity to be visible. In fact, the concept of stretching can be generalised. If the stretching shown in Figures 5, 6, and 7 can be termed X-distortion, then stretching in both directions (XY-distortion) can be advantageous in, for example, the display of calendars (Figure 6) and metro maps (Figure 1): in both these applications the continuity of information space is a distinct advantage. The term 'rubber-sheet stretching' (Tobler 1973; Mackinlay et al. 1991; Sarkar et al. 1993) was seen to neatly explain both the graphical/topological distortion and continuity aspects of focus-plus-context presentations. It is possible that the latter freedom led to use of the term 'fish-eye display' as synonymous with 'bifocal display'. Note that the taxonomy developed by Ying Leung and Apperley (Leung and Apperley 1993a; Leung and Apperley 1993b) discusses the relationships and differences between the bifocal and fish-eye concepts.

Combined X- and Y- distortion provides a convenient calendar interface

Author/Copyright holder: Courtesy of Bob Spence. Copyright terms and licence: CC-Att-ND-3 (Creative Commons Attribution-NoDerivs 3.0 Unported).

Figure 7.6: Combined X- and Y- distortion provides a convenient calendar interface

7.1.2 Detail Suppression

A second significant feature of the bifocal display is the ability to customise the representation of an item for its appearance in the context region, where fine detail is irrelevant or even inappropriate (see, for example, the London Underground map of Figure 1, where no attempt is made to provide station detail in the context region). The concept of 'degree of interest', later to be formalised by George Furnas (Furnas 1986) might, for example lead to the suppression of text and the possible introduction of alternative visual cues, such as shape and colour, with a view to rendering the item more easily distinguished when in the context region. Whereas the bifocal concept is primarily explained as a presentation technique, it was immediately apparent that the effectiveness of the presentations could be enhanced by corresponding variations in representation, utilising the implicit degree of interest of the focus and context regions.

7.1.3 Interaction: scrolling/panning

Yet a third feature of the bifocal concept concerned manual interaction with the display to achieve scrolling or panning. In the envisionment video (Apperley and Spence 1980) the user is seen scrolling by touch, immediate visual feedback ensuring easy positioning of a desired item in the focus region (see Figure 7). Truly direct manipulation, as in touch, is vital for predictable navigation in a distorted space, and overcomes the issues of scale and speed (Guiard and Beaudouin-Lafon 2004) typically associated with combined panning and zooming operations. The impact and potential of multi-touch interfaces in such interaction is mentioned later.

Direct interaction with the Bifocal Display allows a specific item or area to be dragged into the focus region (from Video 5)

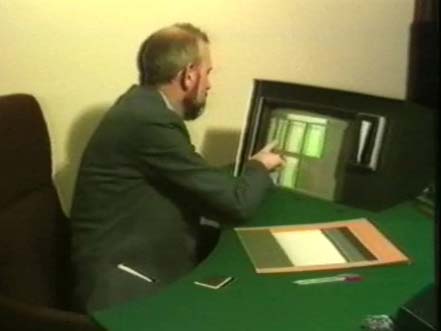
Author/Copyright holder: Courtesy of Robert Spence, with the assistance of Colin Grimshaw of the Imperial College TV studio. Copyright terms and licence: CC-Att-ND (Creative Commons Attribution-NoDerivs 3.0 Unported)

Figure 7.7: Direct interaction with the Bifocal Display allows a specific item or area to be dragged into the focus region (from Video 5)

The Perspective Wall from 1991 has much in common with the bifocal display.

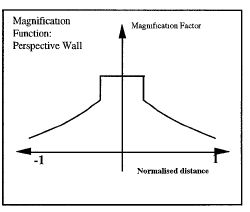
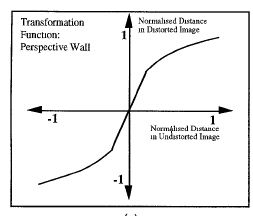
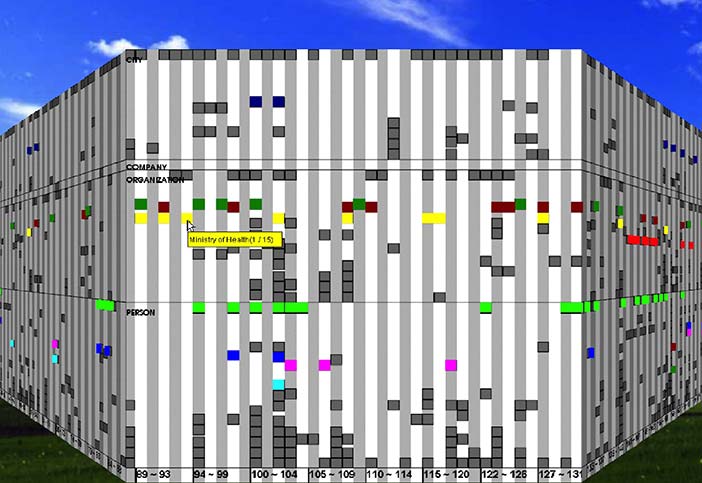
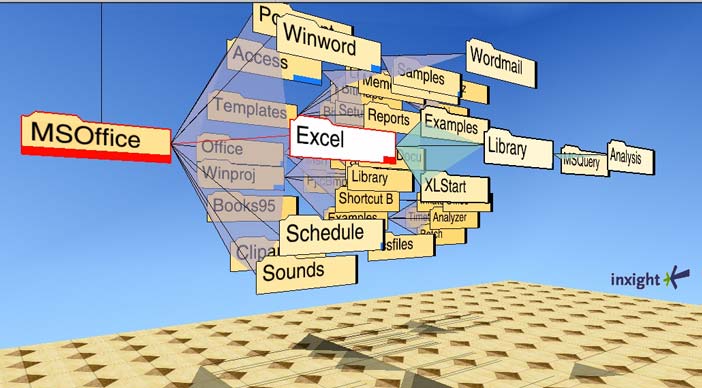
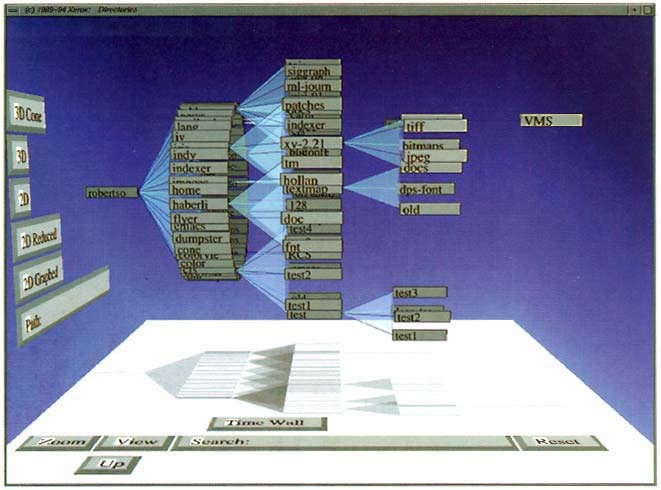
Author/Copyright holder: Courtesy of Inxight Software, Inc (screenshot of Perspective Wall). Copyright terms and licence: Unknown (pending investigation). See section "Exceptions" in the copyright terms below.

Figure 7.8: The Perspective Wall from 1991 has much in common with the bifocal display.

The Neighbourhood Explorer (Spence 2001; Apperley et al. 2001). Properties further away from the object of interest on each axis are shown as icons with little detail.

Author/Copyright holder: Courtesy of Mark D. Apperley and Robert Spence. Copyright terms and licence: CC-Att-ND (Creative Commons Attribution-NoDerivs 3.0 Unported).

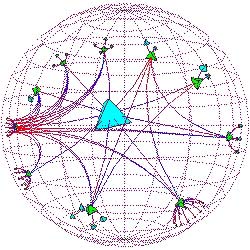
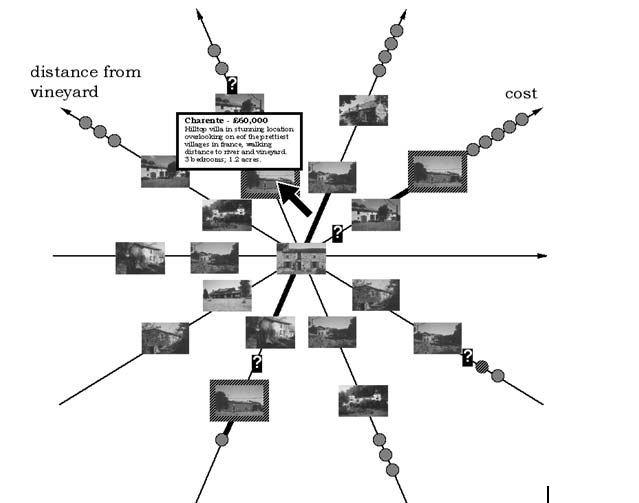
Figure 7.9: The Neighbourhood Explorer (Spence 2001; Apperley et al. 2001). Properties further away from the object of interest on each axis are shown as icons with little detail.

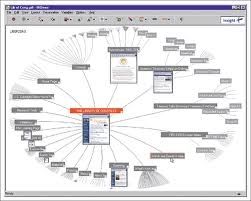
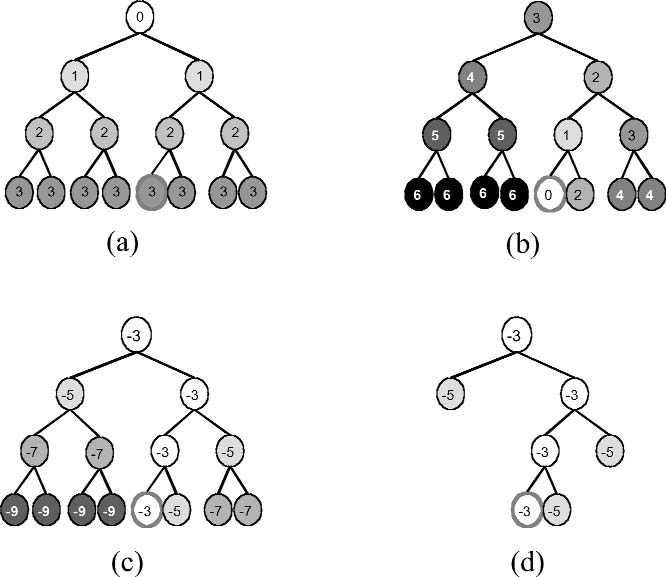
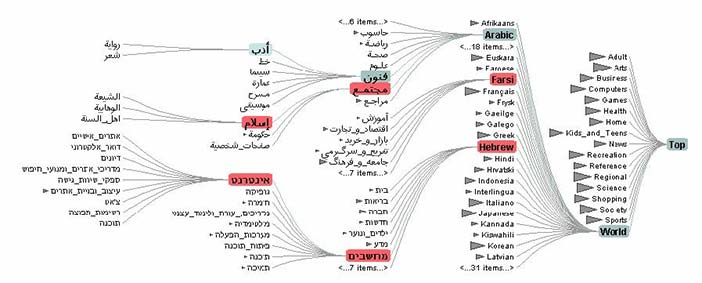
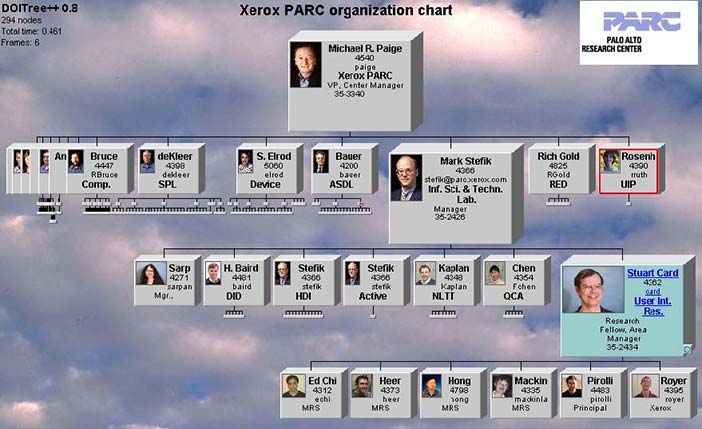
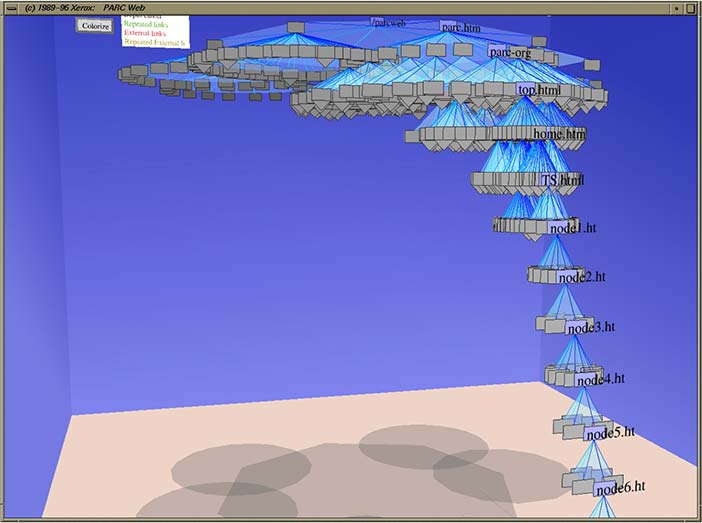
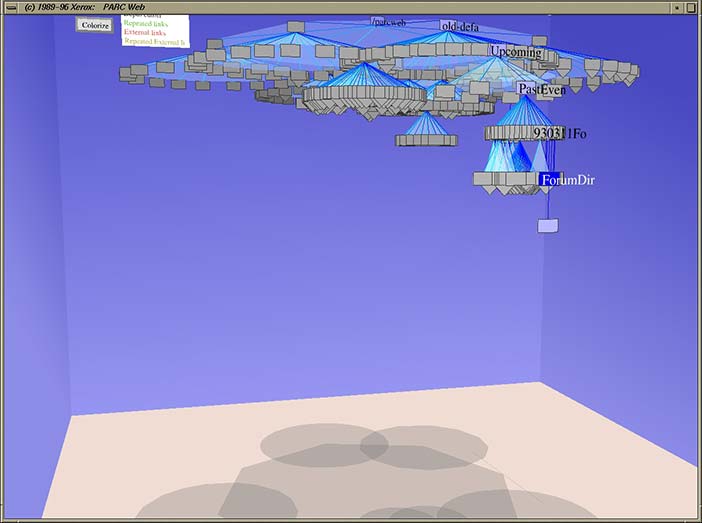
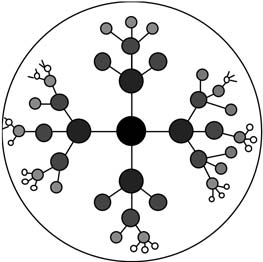
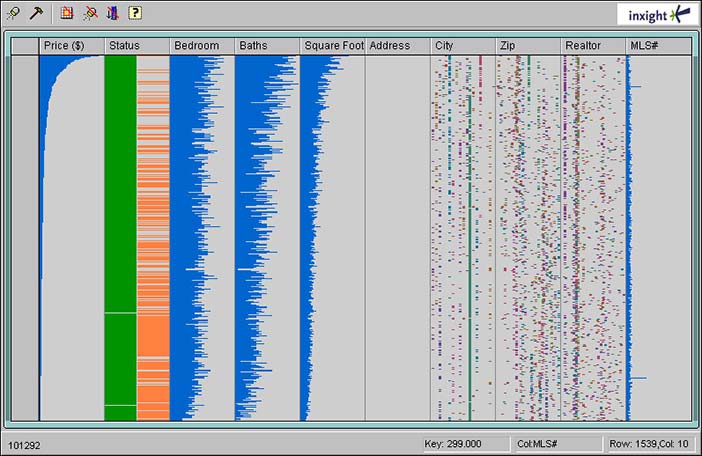
Later work by Apperley and Spence and colleagues described generalizations of the Bifocal Display concept and a useful taxonomy (Leung and Apperley 1993a,b,c,d; Leung et al. 1995). In 1991 a three-dimensional realization of the Bifocal Display, termed the Perspective Wall (Figure 8), was described (Mackinlay et al. 1991). In the Neighbourhood Explorer (Figure 9), Apperley and Spence applied the Bifocal Display concept to the task of home-finding (Spence 2001, page 85; Apperley et al. 2001) in a multi-axis representation. A very effective application of the Bifocal concept to interaction with hierarchically structured data was described by John Lamping and Ramana Rao (Lamping and Rao 1994) who employed a hyperbolic transformation to ensure that, theoretically, an entire tree was mapped to a display (Figure 10). In the same year, Rao and Stuart Card (Rao and Card 1994) described the Table Lens (Figure 12) which, also, employed the concept of stretching.

A sketch illustration of the hyperbolic browser representation of a tree. The further away a node is from the root node, the closer it is to its superordinate node, and the area it occupies decreases

Author/Copyright holder:Courtesy of Robert Spence. Copyright terms and licence: CC-Att-ND (Creative Commons Attribution-NoDerivs 3.0 Unported).

Figure 7.10: A sketch illustration of the hyperbolic browser representation of a tree. The further away a node is from the root node, the closer it is to its superordinate node, and the area it occupies decreases (Spence 2001)

Distorted map on a PDA, showing the continuity of transportation links

Author/Copyright holder: David Baar, IDELIX Software Inc. Copyright terms and licence: All Rights Reserved. Reproduced with permission. See section "Exceptions" in thecopyright terms below.

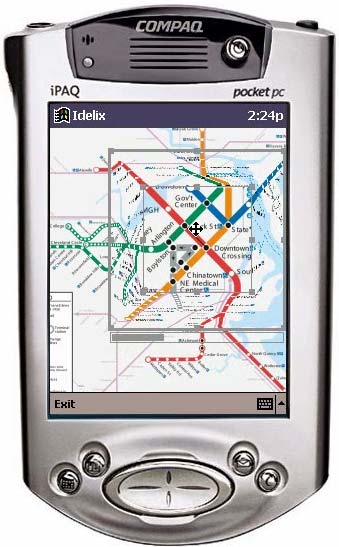
Figure 7.11: Distorted map on a PDA, showing the continuity of transportation links

Screenshot of the Table Lens. The Table Lens incorporates the concept of stretching in both X and Y dimensions to provide focus plus context (Rao and Card 1994)

Author/Copyright holder: Courtesy of Inxight Software, Inc (screenshot of Table Lens). Copyright terms and licence: Unknown (pending investigation). See section "Exceptions" in the copyright terms below.

Figure 7.12: Screenshot of the Table Lens. The Table Lens incorporates the concept of stretching in both X and Y dimensions to provide focus plus context (Rao and Card 1994)

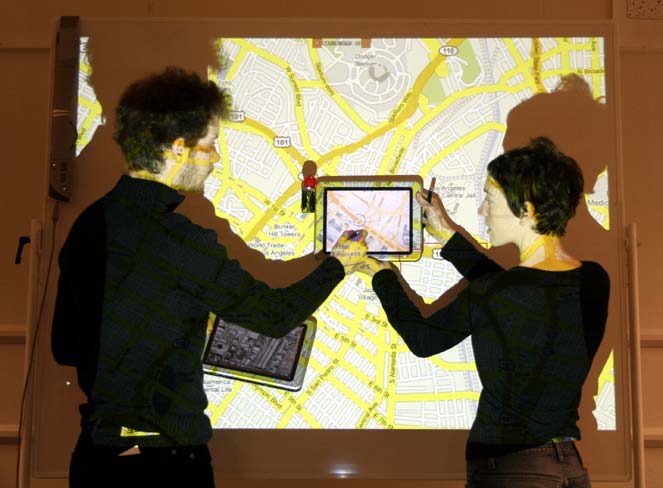
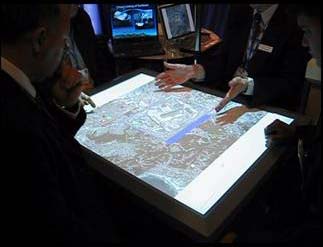
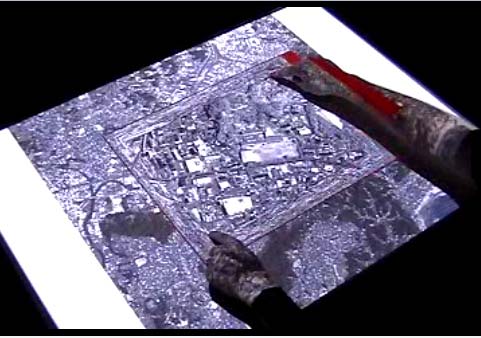
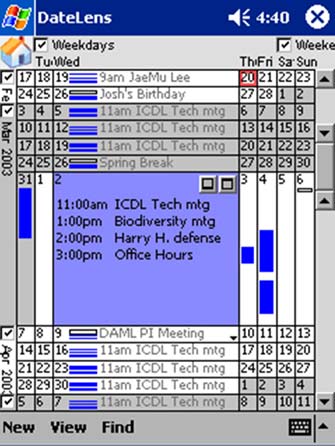
The commercial development by IDELIX of software that would implement the concept of the Bifocal Display allowed that company to demonstrate the concept in a number of applications. In one, a transportation map of the Boston area could be examined on the limited display area of a PDA (Figure 11) through the appropriate manual control of panning and variable stretching; automatic degree-of-interest adjustment was employed to make the best use of available display area. By contrast, another application (Figures 13 and 14) employed a table-top display, with four simultaneous users independently controlling the stretching of different areas of the map in order to inspect detail. The value of the Bifocal Display concept to a user's interaction with a calendar was demonstrated by Ben Bederson, Aaron Clamage, Mary Czerwinski and George Robertson (Bederson et al 2004) - see Figure 15.

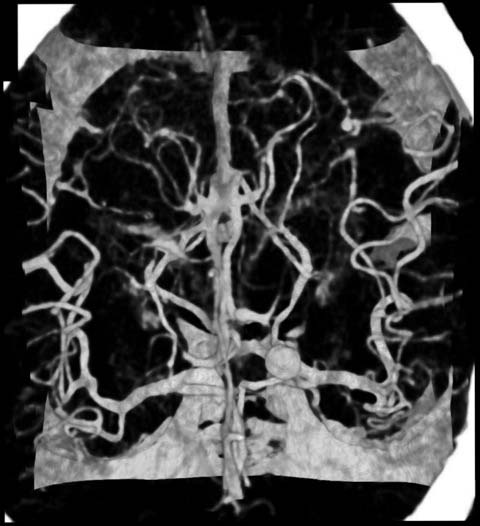
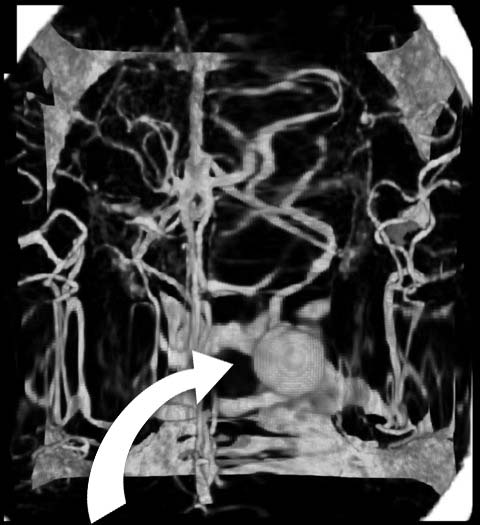
In a medical application of the bifocal concept a 3D image of a portion of the brain has been distorted to focus on the region around an aneurysm, with the surrounding network of arteries as the context (Cohen et al. 2005) - see Figure 16 and Figure 17.

Distorted map on a table (from 2005)

Author/Copyright holder: Unknown (pending investigation). Copyright terms and licence: Unknown (pending investigation). See section "Exceptions" in the copyright terms below.

Figure 7.13: Distorted map on a table (from 2005)

Distorted map on a table (from 2005)

Author/Copyright holder: Clifton Forlines, Chia Shen, and Mitsubishi Electric Research Labs. Copyright terms and licence: All Rights Reserved. Reproduced with permission. See section "Exceptions" in the copyright terms below.

Figure 7.14: Distorted map on a table (from 2005)

Use of the Bifocal Display concept in a PDA-based calendar (Bederson et al. 2004)

Author/Copyright holder: Bederson et al. Copyright terms and licence: All Rights Reserved. Reproduced with permission. See section "Exceptions" in the copyright terms below.

Figure 7.15: Use of the Bifocal Display concept in a PDA-based calendar (Bederson et al. 2004)

A 3D medical dataset of a brain aneurysm without bifocal distortion (Cohen et al. 2005)

Author/Copyright holder: IEEE, Marcelo Cohen, Ken Brodlie, and Nick Phillips. Copyright terms and licence: All Rights Reserved. Reproduced with permission. See section "Exceptions" in the copyright terms below.

Figure 7.16: A 3D medical dataset of a brain aneurysm without bifocal distortion (Cohen et al. 2005)

Bifocal distortion applied to the dataset (Cohen et al. 2005)

Author/Copyright holder: IEEE, Marcelo Cohen, Ken Brodlie, and Nick Phillips. Copyright terms and licence: All Rights Reserved. Reproduced with permission. See section "Exceptions" in the copyright terms below.

Figure 7.17: Bifocal distortion applied to the dataset (Cohen et al. 2005)

7.2 The Future

Research is needed into the fundamental cognitive and perceptual reasons why, and in what circumstances, awareness of context is particularly useful, so that the potential of the bifocal, Degree-of-Interest and other focus+context techniques, alone or in concert, can be assessed for a specific application. The advent of multi-touch screens, and their associated (extreme) direct manipulation, has opened enormous opportunities for improved interaction techniques in navigating large spaces. The single gesture combined pan-zoom operation possible with a multi-touch display offers exciting possibilities for further development and utilisation of the bifocal concept (Forlines and Shen 2005).

7.3 Where to learn more

A chapter of Bill Buxton's book (Buxton 2007) is devoted to the Bifocal Display. The bifocal concept is also treated in many texts associated with Human-computer Interaction, under a variety of index terms: distortion (Ware 2007), bifocal display (Spence 2007; Mazza 2009), and focus+context Tidwell (Tidwell 2005).

7.4 Videos

Appreciation of the Bifocal Display concept can be helped by viewing video presentations. A selection is given below.

Author/Copyright holder: Unknown (pending investigation). Copyright terms and licence: Unknown (pending investigation). See section "Exceptions" in the copyright terms below.

The Bifocal Display

Author/Copyright holder: Robert Spence. Copyright terms and licence: ll Rights Reserved. Reproduced with permission. See section "Exceptions" in the copyright terms below.

The Bifocal Display

Author/Copyright holder: IDELIX Software. Copyright terms and licence: All Rights Reserved. Reproduced with permission. See section "Exceptions" in the copyright terms below.

Distorted map on a PDA (52 seconds, silent)

Author/Copyright holder: Clifton Forlines, Chia Shen and Mitsubishi Electric Research Labs. Copyright terms and licence: All Rights Reserved. Reproduced with permission. See section "Exceptions" in the copyright terms below.

Pliable display Technology on a table (3 minutes)

Author/Copyright holder: IDELIX Software. Copyright terms and licence: All Rights Reserved. Reproduced with permission. See section "Exceptions" in the copyright terms below.

Rubber sheet map distortion (33 seconds, silent)

Author/Copyright holder: Jock D. Mackinlay, George D. Robertson and Stuart K. Card. Copyright terms and licence: All Rights Reserved. Reproduced with permission. See section "Exceptions" in the copyright terms below.

The Perspective Wall (54 seconds)

7.5 References

Apperley, Mark and Leung, Y. K. (1993b): A taxonomy of distortion-oriented techniques for data presentation. In:Salvendy, Gavriel and Smith, M. J. (eds.). "Advances in Human Factors/Ergonomics Vol 19B, Human-Computer Interaction: Software and Hardware Interfaces". Amsterdam, Holland: Elsevier Science Publisherspp. 105-109

Apperley, Mark and Leung, Y. K. (1993a). A Unified Theory of Distortion-Oriented Presentation Techniques. Massey University

Apperley, Mark and Spence, Robert (1980). Video: bifocal display concept video. Retrieved 4 November 2013 from https://www.interaction-design.org/tv/bifocal_displ...

Apperley, Mark and Spence, Robert (1981): A Professional's Interface Using the Bifocal Display. In: Proceedings of the 1981 Office Automation Conference 1981. pp. 313-315

Apperley, Mark, Spence, Robert and Wittenburg, Kent (2001): Selecting One from Many: The Development of a Scalable Visualization Tool. In: HCC 2001 - IEEE CS International Symposium on Human-Centric Computing Languages and Environments September 5-7, 2001, Stresa, Italy. pp. 366-372

Apperley, Mark, Tzavaras, I. and Spence, Robert (1982): A Bifocal Display Technique for Data Presentation. In:Eurographics 82 Proceedings 1982, Amsterdam. pp. 27-43

Bederson, Benjamin B., Clamage, Aaron, Czerwinski, Mary and Robertson, George G. (2004): DateLens: A fisheye calendar interface for PDAs. In ACM Transactions on Computer-Human Interaction, 11 (1) pp. 90-119

Buxton, Bill (2007): Sketching User Experiences: Getting the Design Right and the Right Design. Morgan Kaufmann

Cohen, Marcelo, Brodlie, Ken and Phillips, Nick (): Hardware-accelerated distortion for volume visualisation in medicine. In: Proceedings of the 4th IEEE EMBSS UKRI PG Conference on Biomedical Engineering and Medical Physics 2005 . pp. 29-30

Farrand, William A. (1973). Information display in interactive design, Doctoral Thesis. University of California at Los Angeles

Forlines, Clifton and Shen, Chia (2005): DTLens: multi-user tabletop spatial data exploration. In: Proceedings of the 2005 ACM Symposium on User Interface Software and Technology 2005. pp. 119-122

Furnas, George W. (1986): Generalized Fisheye Views. In: Mantei, Marilyn and Orbeton, Peter (eds.) Proceedings of the ACM CHI 86 Human Factors in Computing Systems Conference April 13-17, 1986, Boston, Massachusetts. pp. 16-23

Guiard, Yves and Beaudouin-Lafon, Michel (2004): Target acquisition in multiscale electronic worlds. InInternational Journal of Human-Computer Studies, 61 (6) pp. 875-905

Lamping, John and Rao, Ramana (1994): Laying Out and Visualizing Large Trees Using a Hyperbolic Space. In:Szekely, Pedro (ed.) Proceedings of the 7th annual ACM symposium on User interface software and technologyNovember 02 - 04, 1994, Marina del Rey, California, United States. pp. 13-14

Leung, Ying K. and Apperley, Mark (1993): E{cubed}: Towards the Metrication of Graphical Presentation Techniques for Large Data Sets. In: East-West International Conference on Human-Computer Interaction: Proceedings of the EWHCI93 1993. pp. 9-26

Leung, Ying K. and Apperley, Mark (1993): Extending the Perspective Wall. In: Proceedings of OZCHI93, the CHISIG Annual Conference on Human-Computer Interaction 1993. pp. 110-120

Leung, Y. W. and Apperley, Mark (1994): A Review and Taxonomy of Distortion-Oriented Presentation Techniques. In ACM Transactions on Computer-Human Interaction, 1 (2) pp. 126-160

Leung, Ying K., Spence, Robert and Apperley, Mark (1995): Applying Bifocal Displays to Topological Maps. InInternational Journal of Human-Computer Interaction, 7 (1) pp. 79-98

Mackinlay, Jock D., Robertson, George G. and Card, Stuart K. (1991): The Perspective Wall: Detail and Context Smoothly Integrated. In: Robertson, Scott P., Olson, Gary M. and Olson, Judith S. (eds.) Proceedings of the ACM CHI 91 Human Factors in Computing Systems Conference April 28 - June 5, 1991, New Orleans, Louisiana. pp. 173-179

Mazza, Riccardo (2009): Introduction to Information Visualization. Springer

Modine, Austin (2008). Apple patents OS X Dock. Retrieved 9 November 2010 from The Register: http://www.theregister.co.uk/2008/10/08/apple_pate...

Rao, Ramana and Card, Stuart K. (1994): The Table Lens: Merging Graphical and Symbolic Representations in an Interactive Focus+Context Visualization for Tabular Information. In: Adelson, Beth, Dumais, Susan and Olson, Judith S. (eds.) Proceedings of the ACM CHI 94 Human Factors in Computing Systems Conference April 24-28, 1994, Boston, Massachusetts. pp. 318-322

Sarkar, Manojit, Snibbe, Scott S., Tversky, Oren J. and Reiss, Steven P. (1993): Stretching the Rubber Sheet: A Metophor for Visualizing Large Layouts on Small Screens. In: Hudson, Scott E., Pausch, Randy, Zanden, Brad Vander and Foley, James D. (eds.) Proceedings of the 6th annual ACM symposium on User interface software and technology 1993, Atlanta, Georgia, United States. pp. 81-91

Spence, Robert (2007): Information Visualization: Design for Interaction (2nd Edition). Prentice Hall

Spence, Robert (2001): Information Visualization. Addison Wesley

Spence, Robert and Apperley, Mark (1982): Data Base Navigation: An Office Environment for the Professional. InBehaviour and Information Technology, 1 (1) pp. 43-54

Tidwell, Jenifer (2005): Designing Interfaces: Patterns for Effective Interaction Design. O'Reilly and Associates

Tobler, W. R. (1973): A continuous transformation useful for districting. In Annals of the New York Academy of Sciences, 219 p. 215–220

Ware, Colin (2004): Information Visualization: Perception for Design, 2nd Ed. San Francisco, Morgan Kaufman

Chapter TOC

7.5 Commentary by Stuart K. Card

7.5.0.1 The Design Space of Focus + Context Displays

Robert Spence and Mark Apperley have done a fine job of introducing the bifocal display and subsequent explorations of this idea. In this commentary, I want to bring forward the structure of the design space that has emerged and capture some of the abstractions. Then I want to offer a few conjectures about what we have learned about focus + context displays.

The bifocal display is an approach to a general problem: The world presents more information than is possible for a person, with her limited processing bandwidth, to process. A pragmatic solution to this problem is expressed by Resnikoff’s (1987) principle of the “selective omission and recoding of information”—some information is ignored while other information is re-encoded into more compact and normalized forms. The bifocal display exemplifies an instance of this principle by dividing information into two parts: a broad, but simplified, contextual overview part and a narrow, but detailed, focal part. In the contextual overview part, detailed information is ignored or recoded into simplified visual form, whereas in the focal part, more details are included, possibly even enhanced. This roughly mimics the strategy of the human perceptual system, which actually uses a three-level hierarchical organization of retina, fovea, and periphery to partition limited bandwidth between the conflicting needs for both high spacial resolution and wide aperture in sensing the visual environment (Resnikoff, 1987). Visual features picked up in the periphery (for example, a moving something) direct the aim-able, high-resolution fovea/retina and attention to that place of interest, thereby resolving it (for example, into a charging lion).

Spence and Apperley at Imperial College London had the idea that this principle of focus + context could be applied not just to the perceiving agent, but also to the display of the data itself. The working problem for Spence and Apperley was how to organize the dynamic visualization of an electronic workspace. In their solution, documents or journal articles in the focal part were rendered in detail, whereas the documents in the contextual part were foreshortened or otherwise aggregated to take less space and show less detail (Figure 7.1). The detail part of the display could be refocused around a different place in the context area, making it the new focus. Spence and Apperley’s method provided a dynamic solution to the use of limited screen space, reminiscent of the dynamics of a pair of bifocal glasses, hence the name bifocal display. Their contribution was the conceptual model of the bifocal display, how by using this technique workspaces could be made effectively larger and more efficient, and how this technique could be applied to a broader set of tasks. The first documentation of their technique was expressed in a video of the concept shot in December 1980 (edited in January 1981). Documentation was further published in a journal article in 1982 (Spence and Apperley, 1982)

Figure 7.1 A-B: Bifocal display applied to desktop workspace (from Figures 7.3 and 7.5 of Spence and Apperley's article). a) Workspace b) Bifocal representation of workspace

About the same time, George Furnas at Bell Labs had a related idea. Furnas’s working problem was how to access statements in long computer program listings. The programmer needed to be able to see lines of code in context, for example declarations of variables that might be several pages back from the current point of interest in the code. He noted that there were intriguing responses to this problem found in everyday life. One famous example is the Steinberg cartoon New Yorker Magazine cover showing the world as perceived by a New Yorker on 9th Avenue. Here, detail falls off with increasing distance from 9th Avenue, but there is also more detail than would be expected for Las Vegas and a few other spots of interest to a 9th-Avenue New Yorker. Another example from everyday life is the fisheye lens for a photographic camera, with its distorted enlargement of the central image and shrunken rendering of the image periphery. Furnas’s contribution was the invention of a computational degree-of-interest (DOI) function for dynamically assigning a user’s relative degree of interest for different parts of a data structure. He then was able to use his DOI function to partition information into more focal and more peripheral parts. His function had two terms, one term expressing the intrinsic importance of something, the other expressing the effect of distance from the point of interest. This function in many cases seemed to create a natural way of compressing information. For example, Figure 7.2, taken from his original 1982 memo, gives a fragment of a computer program when the user’s focus is at line 39. After computing the Degree of Interest Function value for each line of the program, those lines with DOI below a threshold are filtered out, resulting in the more compact fisheye view in Figure 7.3. The fisheye view version makes better use of space for the program listing. It brings into the listing space information that is at this moment highly relevant to the programmer, such as the includes statement, the variables declaration statement, the controlling while-loop statement, and the conditional statement.  It makes room for these by omitting details  relevant to the programmer at the moment, such as in some of the case statements. The first documentation of his technique was an internal Bell Labs memo in October of 1982 (Furnas, 1982), widely circulated at the time among the research community, but not formally published until 1999 (Furnas, 1982/1999).  The first formal published paper was (Furnas G. , 1986).

 
   28 			t[0] = (t[0] + 10000)
   29 				   - x[0];
   30 			for(i=1;i<k;i++){
   31 			t[i] = (t[i] + 10000)
   32 				   - x[i]
   33 				   - (1 - t[i-1]/10000);
   34 			t[i-1] %= 10000;
   35 			}	
   36 			t[k-1] %= 10000;
   37 			break;
   38 		case 'e':
 >>39 			for(i=0;i<k;i++) t[i] = x[i];
   40 			break;
   41 		case 'q':
   42 			exit(0);
   43 		default:
   44 			noprint = 1;
   45 			break;
   46 	}
   47 	if(!noprint){
   48 		for(i=k - 1;t[i] <= 0 && i &rt; 0;i--);
   49 		printf("%d",t[i]);
   50 		if(i &rt; 0) {
Figure 7.2: Fragment of program listing before applying fisheye view. Fisheye view of program listing. Line 39 (in red) is the focus.
   1 #define DIG 40
   2 #include 
...4 main()
   5 {
   6      int c, i, x[DIG/4], t[DIG/4], k = DIG/4, noprint = 0;
...8      while((c=getchar()) != EOF){
   9           if(c >= '0' && c <= '9'){
...16           } else {
   17                switch(c){
   18                     case '+':
...27                     case '-':
...38                    case 'e':
 >>39                          for(i=0;i<k;i++) t[i] = x[i];
   40                          break;
   41                     case 'q':
...43                     default:
...46                }
   47                if(!noprint){
...57               }
   58           }
   59           noprint = 0;
   60      }
   61 }	
	
Figure 7.3: A fisheye view of the C program. Line numbers are in the left margin. “...” indicates missing lines. Note that the variable declarations and while-loop initiation are now on the same page. Line 39 (in red) is the focus.

It is helpful to consider bifocal displays or fisheye views as contrasted with an alternative method of accessing contextual and focal information: overview + detail. Figure 7.4 shows the data of the Spence and Apperley bifocal display as an overview + detail display. The advantage of overview + detail is that it is straightforward; the disadvantage is that it requires moving the eye back and forth between two different displays. The bifocal display essentially seeks to fit the detail display within the contextual display, thereby avoiding this coordination and its implied visual search.

Figure 7.4 A-B: Overview + detail display. a) Overview b) Detail

Despite the original names of “bifocal display” or “fisheye view”, the collection of techniques derived from these seminal papers, both by the authors themselves as well as by others, go well beyond the visual transformation fisheye implies and beyond two levels of representation the name bifocal implies. These displays might be called attention-aware displays because of the way in which they use proxies for user attention to dynamically reallocate display space and detail. Pragmatically, I will refer to the general class as focus + context techniques to emphasize the connection beyond the visual to user attention and to avoid having to say “bifocal display or fisheye view” repeatedly.

7.5.0.2 Focus + Context Displays as Visualization Transformations

Focus + context techniques are inherently dynamic and lead us to think of information displays in terms of space × time × representation transformations. The classes of representations available can be seen in terms of the information visualization reference model (Card, Mackinlay, & Shneiderman, 1999) reproduced in Figure 7.5. This framework traces the path from raw data to visualization as the data is transformed to a normalized form, then mapped into visual structures, and then remapped into derivative visual forms. The lower arrows in the diagram depict the fact that information visualizations are dynamic. The user may alter the parameters of the transformations for the visualizations she is presently viewing

Information visualization reference model (Card, Mackinlay, and Shneiderman, 1999)
Figure 7.5: Information visualization reference model (Card, Mackinlay, and Shneiderman, 1999)

Focus + context displays mix the effects of two transformations of the Information Visualization Reference Model: view transformations and visual mappings. View transformations use a mapping from space into space that distorts the visualization in some way. Some can be conveniently described in terms of a visual transfer function for achieving the focus + context effect. The bifocal display was the first of these and inspired later work.

Visual mappings are concerned with a mapping from data to visual representation, including filtering out lower levels of detail.  The design space of filters for visual mappings with respect to filtering can often be conveniently  described in terms of choices for degree-of-interest functions applied to the structure or content of the data and how these are used to filter level of detail. It also inspired later work.

This convenient historical correlation, however, between geometrically-oriented techniques and the bifocal display on the one hand and data-oriented level-of-detail filtering degree-of-interest techniques on the other does not reach to the essence of these techniques either analytically or historically. Even in the initial papers, Spence and Apperley did not simply apply geometrical transformations, but also understood the advantages of changing the representation of the data in context and focal parts of the display, as in Figure 6 from their original paper, which shows a simple representation of months in the context part of the display expanded to a detailed representation of daily appointments in the focal part of the display.  Conversely, Furnas in his first memo on the fisheye view included a section on “Fisheye view of Euclidean space” and so understood the potential use of his technique to visual transformations. Nor do these techniques exhaust the possibilities for dynamic focus + context mappings.

Example of bifocal display semantic representation change (from  Spence and Apperley's Figure 7.6).
Figure 7.6: Example of bifocal display semantic representation change (from Spence and Apperley's Figure 7.6).

The essence of both bifocal displays and fisheye views is that view transformations and visual mapping transformations actively and continually change the locus of detail on the display to support the task at hand. The combination of possible transformations generates a design space for focus + context displays. To appreciate the richness of this design space generated by the seminal ideas of Spence & Apperley and Furnas, we will look at a few parametric variations of visual transfer functions and degree-of-interest functions.

7.5.0.3 View Transformations as Visual Transfer Functions

View transformations transform the geometry of the space. The bifocal display workspace has two levels of magnification, as illustrated in Figure 7.7.B. From the function representing these two levels of magnification, we can derive the visual transfer function in Figure 7.7.C., which shows how a point in the image is transformed. The two levels of constant magnification in the magnification function, one for the peripheral context region, the other for the focal region, yield a visual transfer function (which is essentially the integral of the magnification function). The result of applying this transformation to the original image, Figure 7.7.A.,  is the image shown in Figure 7.7.D, foreshortening it on the sides.

Figure 7.7 A-B-C-D: Bifocal display visual transfer function of a bifocal display.: (a) Original image (b) Magnification function (c) Visual Transfer function (d) Transformed workspace

Rubber Geometry: Alternate Visual Transfer Functions. It is apparent that the visual transfer function can be generalized to give many alternate focus + context displays. Leung and Apperley (1994) realized early on that the visual transfer function was a useful way to catalogue many of the variations of these kinds of displays and did so. Ironically, among the first of these addressed by Leung and Apperley (1994) is the visual transfer function of a true (optical) fisheye lens, which had mostly been discussed metaphorically by Furnas (1982). The fisheye magnification function (Figure 7.8.A) and the resulting visual transfer function (Figure 7.8.B) result in the transformed workspace in Figure 7.8.C, depicted by showing how it distorts gridlines

Figure 7.8 A-B-C: Visual Transfer function of a fisheye lens (Leung and Apperley, 1994): (a) Magnification function. (b) Visual Transfer function. (c) Transformed workspace.

Notice that in Figure 7.8.A rather than just two magnification levels, there is now a con-tinuous function of them. Notice also that unlike Figure 7.7.C, which describes a one-dimensional function, Figure 7.8.B is shorthand for a two-dimensional function, as is apparent in Figure 7.8.B. There are many forms the visual transfer function could take. An interesting subset of them is called rubber sheet transfer functions, so-called because they just seem to stretch a continuous sheet. Figure 7.9 shows a few of these.

Figure 7.9 A-B-C: Rubber sheet visual transform functions. (Carpendale, 2001). (a) Gausian Transfer function (b) Cosine Transfer function (c) Linear Transfer function

Natural Perspective Visual Transfer Functions. One problem with rubber sheet visual transfer functions is that the distortion can be somewhat difficult to interpret, as the mapping from original (Figure 7.10.A) to transformed image (Figure 7.10.B) shows, although this can be mitigated by giving the visual transfer function a flat spot in the center.

Figure 7.10 A-B: Example of distortion engendered by some visual transfer functions (Carpendale, 2006/2012). (a) Original image (b) Transformed image

An interesting alternative is to use natural perspective visual transfer functions. These functions achieve the required contrast in magnification between the two regions, but the trick is that the display doesn’t look distorted. The perspective wall (Figure 7.11.C) is such a display. As we can see by the magnification function (Figure 7.11.A), part of the magnification function is flat, thereby solving the distortion problem, but part of the magnification function on the sides is curved. Yet the curved sides do not appear distorted because the curve matches natural perspective and so is effectively reversed by the viewer’s perceptual system (although comparative judgments can still be adversely affected). Touching an element on one of the side panels causes the touched part of the “tape” to slide to the front thereby achieving the magnification of the magnification function in Figure 7.11.A and moving contextual information into focal position. The point is that by using a natural perspective visual transfer function, we get the space-saving aspects of focus + context displays, but the user doesn’t think of it as distortion. It just seems natural.

Figure 7.11 A-B-C: The perspective wall (Mackinlay, Robertson, and Card, 1991): (a) Magnification function (b) Visual Transfer function (c) Transformed workspace

Three-Dimensional Visual Transfer Functions. The perspective wall introduces another element of variation. The visual transfer function can be in three dimensions. Figure 7.12 shows another such visualization, the document lens (Robertson & Mackinlay, 1993). The document lens is used with a book or a report (Card, Robertson, & York, 1996). The user commands the book to change into a grid of all the book’s pages. A search lights up all the phrases of interest and makes clear which pages would be most interesting to examine in detail. The user then reaches in and pulls some pages forward, resulting in Figure 7.12. Even though she is reading one (or a set) of pages in her detail area, all of the pages remain visible as context. Furthermore, since this is a perceptual transformation, the context pages are not experienced as distorted.

The Document Lens (Robertson and Mackinlay, 1993)
Figure 7.12: The Document Lens (Robertson and Mackinlay, 1993)

Natural perspective visual transfer functions fit almost invisibly into strong visual met-aphors and so can be used to produce focus + context effects without drawing attention to themselves as a separate visualization. Figure 7.13.A shows 3Book (Card, Hong and Mackinlay, 2004) a 3D electronic book. There is not room on the screen to show the double page open book, so the view is zoomed into the top left-hand page (the focus) and the right-hand page is bent backward but not completely, so the contents on it are still visible (the context). The reader can see that there is an illustration on the right-hand page and clicking on it causes the book to rock to the position shown in Figure 7.13.B, thus making the right-hand page the focus and the left-hand page the context. In this way, the rocker page focus + context technique is able to preserve more context for the reader while fitting within the available space resource.

Figure 7.13 A-B: Book use of rocker page focus + context effect (Card, Hong, and Mackinlay, 2004): (a) Left-hand page is focus. Right-hand page is bent partially back, forming context. (b) Book rocks causing left-hand page to become context and right-hand page to become focus

Hyperbolic Visual Transfer Functions. One particularly interesting visual transfer function that has been tried is a hyperbolic mapping.  With a hyperbolic function it is possible to compensate for the exponential growth of a graph by shrinking size space on which the graph is projected.  This is because an infinite hyperbolic space can be projected onto a finite part of a Euclidean space. As with all focus + context techniques, the part of the graph that is the focus can be moved around with the size adjusted appropriately. Figure 7.14 shows examples of hyperbolic visual transfer functions. Figure 7.14.A is the hyperbolic equivalent to Figure 7.9Figure 7.14.B shows a hyperbolic tree (Lamping, Rao, and Pirolli (1995). Notice how the nodes are re-represented as small documents when the space gets large enough. Figure 7.14.C gives a 3D version (Munzner & Burchard, 1995; Munzner, 1998). For fun, Figure 7.14.D shows how this idea could be taken even further using a more extreme hyperbolic projection (in this case, carefully constructed by knitting) (Tallmina, 1997) that could serve as an alternate substrate for trees to that in Figure 7.14.B or 7.14.C).

Figure 7.14 A-B-C-D: Hyperbolic visual transfer functions: (a) Hyperbolic visual transform function (Carpen-dale, 2001). (b) Hyperbolic tree (Lamping, Rao, and Pirolli, 1995) (c) 3D Hyperbolic (Munzner and Burchard, 1995; Munzner, 1998). (d) 3D Hyperbolic surface (Tallmina, 1997)

Complex Visual Transfer Functions. Some visual transfer functions are even more complex. Figure 7.15 shows a tree visualized in 3D as a cone tree (Robertson, Mackinlay, & Card, 1991), where each node has a hollow, 3D, rotatable circle of nodes beneath it. Figure 7.15.A. shows a small tree positioned obliquely, Figure 7.15.B. shows a much larger tree seen from the side. Touching an element in one of these trees will cause the circle holding the labels in that circle of the tree and all the circles above to rotate toward the user. The result is that the user will be able to read labels surrounding a point of interest, but natural perspective and occlusion will move into the background nodes of the tree more in the context. The visual transformation uses perspective as well as occlusion to attain a focus + context effect. The shift from focus to context is all done with geometric view transformations, but these are no longer described as a simple visual transfer of the sort in Figure 7.1.C.

Figure 7.15 A-B: Cone tree: (b) Large cone tree from side. (a) Small cone tree showing perspective.

7.5.0.4 Degree-of-Interest Functions as Visual Mapping Transformations

By contrast with view transforms, visual mapping transforms use the content of data to generate physical form. Degree-of-Interest (DOI) functions assign an estimate of the momentary relevance to the user for each part of the data. This value is then used to modify the display dynamically. Suppose we have a tree of categories taken from Roget’s Thesaurus, and we are interacting with one of these, “Hardness” (Figure 7.16.A). We calculate a degree-of-interest (DOI) for each item of the tree, given that the focus is on the node Hardness. To do this, we split the DOI into an intrinsic part and a part that varies with distance from the current center of interest and use a formula from Furnas (1982). Using a DOI function, the original tree can be collapsed to a much smaller tree (Figure 7.16.B) that preserves the focus and relevant parts of the context. How compact the resulting tree is depends on an interest threshold function. This could be a fixed number, but it could also be varied so that the resulting tree fits into a fixed size rectangle. In this way, DOI trees can be made to obtain the important user interface of property of spatial modularity. They can be assigned a certain size part of the screen resource and made to live within that space.

Matter

   ORGANIC vitality

      Vitality in general

      Specific vitality

         Sensation in general

         Specific sensation

INORGANIC Solid

   Hardness

   Softness

      Fluid

         Fluid in general

         Specific fluid


Matter

   ORGANIC vitality

   INORGANIC solid

      Hardness

      Softness

         Fluid


(a) Categories from Roget’s Thesaurus.

(b) Fisheye view of the categories when point of interest is centered on category Hardness.

Figure 7.16: Filtering with Degree-of-Interest function

Of course, this is a small example for illustration. A tree representing a program listing, or a computer directory, or a taxonomy could easily have thousands of lines; a number that would vastly exceed what could fit on the display.

DOI = Intrinsic DOI + Distance DOI

Figure 7.17 shows schematically how to perform this computation for our example. The up-arrow indicates the presumed point of interest. We assume that the intrinsic DOI of a node is just its distance of the root (Figure 7.17.A). The distance part of the DOI is just the traversal distance to a node from the current focus node (Figure 7.17.B; it turns out to be convenient to use negative numbers for this computation, so that the maximum amount of interest is bounded, but not the minimum amount of interest. We add these two numbers together (Figure 7.17.C) to get the DOI of each node in the tree. Then we apply a minimum threshold of interest and only show nodes more interesting than that threshold. The result is the reduced tree in Figure 7.17.D. This is the sort of computation underlying Figure 7.16.D. The reduced tree gives local context around the focus node and progressively less detail farther away. But it does seem to give the important context.

Computation of Degree-Of-Interest for a tree. (a) Intrinsic interest function. (b) Distance function. (c) Sum of (a) and (b). (d) Applying filtering function based on threshold to (c).
Figure 7.17: Computation of Degree-Of-Interest for a tree. (a) Intrinsic interest function. (b) Distance function. (c) Sum of (a) and (b). (d) Applying filtering function based on threshold to (c).

Level-of-Detail Filtering with Degree-of-Interest Functions on multiple foci. Figure 7.18 applies a version of these calculations to a tree with multiple focal points of interest comprising over 600,000 nodes. It is a demonstration that by blending a caching mechanism with the DOI calculation, calculations can be done on very large trees in a small fraction of a second, thereby allowing DOI trees to be used as a component of an animated interface to display contextualized, detail-filtered views of large datasets that will fit on the screen. If we assume the technique would work for at least a million nodes and that maybe 50 nodes would fit on the screen at one time, this demonstrates that we could get insightful, almost instantaneous views of trees 20,000 times larger than the screen would hold—a nice confirmation of the original bifocal display intuition.

TreeBlock, a Degree-of-interest tree algorithm capable of computing and laying out very large trees at animation speeds. The tree here is shown with multiple foci on 600,000 nodes with mixed right-to-
Figure 7.18: TreeBlock, a Degree-of-interest tree algorithm capable of computing and laying out very large trees at animation speeds. The tree here is shown with multiple foci on 600,000 nodes with mixed right-to-left and left-to-right text (Heer and Card, 2004)

Re-Representation through semantic zooming and aggregation DOI functions. Aside from level of detail filtering, it is possible to use the degree-of-interest information in many ways.  In Figure 7.19, it is used (a) for level-of-detail filtering of nodes as previously discussed, (b) to size the nodes themselves, (c) to select how many attributes to display on a node, and (d) for semantic zooming. Semantic zooming substitutes smaller representation of about the same semantic meaning when the node is smaller. For example, the term “Manager” in Figure 7.19 might change to “Mgr.” when the node is small.

Degree-of-Interest calculation used to create an organization chart of PARC (in the early 2000's). Touching a box grows that box and boxes with whose degree of interest has been computed to incre
Figure 7.19: Degree-of-Interest calculation used to create an organization chart of PARC (in the early 2000's). Touching a box grows that box and boxes with whose degree of interest has been computed to increase in size and changes its contents; other boxes get smaller. Doing a search may result in multiple hits and cause several boxes to increase in size.

Combining Visual Transformations with Degree-of-Interest Functions. Of course both of the techniques we have been discussing can be combined. Figure 7.20 shows a cone tree containing all the files in Unix combined with a degree-of-interest function. The whole tree of files is shown in Figure 7.20.A.  Selection focus on different files is shown in Figure 7.20.A and 7.20.B. Since Unix is a large system, this may be the first time anyone has ever “seen” Unix.

Figure 7.20: File in Unix visualized using a cone-tree combined with a degree-of-interest function. (a) Cone tree of all the files in Unix. (b) Use of degree-of-interest algorthm to select a subset of files. (c) Selection of another set of files.

7.5.0.5 The Current State of Focus + Context Displays

Focus + context techniques, inspired by the original work of Spence, Apperley, and Furnas, have turned out to be a rich source of ideas for dealing with information overload by pro-cessing local information in the context of global information structure. Spence and Apperley suggest some future direction for development. I agree with their suggestions and would like to suggest a few observations about what we have learned and what some of the op-portunities are. First the observations:

  1. Two reusable abstractions emerge for generating focus + context effects: (1) visual transfer functions and (2) degree-of-interest functions.
    They structure much of the design space and help us generate new designs.
  2. But these principles may be interfered with by low-level vision phenomena.
    For example, distortions of parallel lines may make the task more difficult. To compensate for this distortion, visual transfer functions can be given flat regions. Flat regions work, but may in turn give rise to an intermediate region between focal and context  areas that creates a difficult-to-read area in the crucial near-focal region. For another example, the contextual part of the tree may form visual blobs, and the eye is attracted to visual blobs, leading it to spend time searching for things in the non-productive part of the tree (Pirolli, Card, & Van der Wege, 2003; Budiu, Pirolli, & Fleetwood, 2006). These uncontrolled effects may interfere with the task.We need to understand better low-level visual effects in focus + context displays.
  3. In general, we need to understand how focus + context displays provide cues to action or sensemaking in a task.
    Distortion in a car rear view fisheye mirror is acceptable because the cue to action is the presence or absence or movement of some object in the mirrors field of view, indicating an unsafe situation.  But if a fisheye display is used as part of a map viewer, the distorted bending of roads may not do well for cuing navigation. The difference is the task. Really we need to do a cognitive task analysis asking just what we are trying to get  out of these displays and why we expect them to work. We have to understand better how focus + context displays work in the flow of the task.
  4. At large magnification ratios, focus + context displays work best when there is an emergent set of representations at the different aggregation levels.
    Using magnification alone can work for modest magnification levels. DOI filtering can work for large magnification ratios because its algorithm effectively shifts to a kind of higher-level aggregation. But the strength of focus + context displays is that they can tie together representations across aggregation levels.

Actually, these observations reflect a deeper set of issues. Focus + context displays trade on subtle interaction between the automatic, perceptually-oriented mechanisms of the user and the user’s more effortful, cognitively-oriented mechanisms, sometimes called System 1 and System 2 (Kahneman, 2012) as well as on the subtle interaction of both of these systems with the demands of the task. The interaction of these mechanisms with the design of focus + context visualizations needs to be better understood. New opportunities for the development of these displays are: the integration with multi-touch input devices or multiple group displays or perhaps the use in automobiles or medical operating rooms. Focus + context displays are about the dynamic partitioning of bandwidth and attention. New information streams for problems, and new input devices for control should insure that this is still a fertile area.

7.5.0.6 References

  1. Budiu, Raluca, Pirolli, Peter, & Fleetwood, Michael (2006). Navigation in degree of interest trees. AVI 2006, Proceedings of the working conference on Advanced Visual Interfaces, 457-462. New York: ACM.
  2. Card, Stuart K., Hong, Lichen, Mackinlay, Jock D. (2004). 3Book: A 3D electronic smart Book.  AVI 2004, Proceedings of the conference on Advanced Visual Interfaces: 303-307.
  3. Card, S. K., Mackinlay, J. D., & Shneiderman, B. (1999). Readings in Information Visualization. San Francisco, CA: Morgan-Kaufmann.
  4. Card, Stuart K. and Nation, David (2002).  Degree-Of-Interest Trees:  A component of an attention-reactive user interface.  AVI 2002, Proceeding of the Conference on Advanced Visual Interfaces (Trento, Italy, May 22-24, 2002), 231-245.
  5. Card, S. K., Robertson, G. G., and York, W. (1996).  The WebBook and the Web Forager.  An information workspace for the World-Wide Web.  Proceedings of CHI ‘96, ACM Conference on Human Factors in Software, New York:  ACM, 111–117.
  6. Carpendale, M.S.T. and Montagnese, Catherine (2001). Rubber sheet visual transform functions. In UIST 2001, Proceedings of the ACM Symposium on User Interface Software and Technology (Orlando, FL). New York: ACM, 61-70.
  7. Carpendale (2006/2012, December 6). Elastic Presentation. Sheelagh Carpenter. Retrieved June 24, 2012 from http://pages.cpsc.ucalgary.ca/~sheelagh/wiki/pmwiki.php?n=Main.Presentation .
  8. Furnas, G. (1986). Generalized fisheye views. CHI '86, Proceeding of the Conference on Human Factors in Computing Systems (Boston). New York: ACM, 16-23.
  9. Furnas, G. W. (1982). The FISHEYE view: A new look at structured files. Technical Memorandum #82-11221-22, Bell Laboratories, Oct. 18.
  10. Furnas, G. W. (1992/1999). The FISHEYE view: A new look at structured files. In Stuart. K. Card, Jock D. Mackinlay, & Ben Shneiderman, Readings in Information Visualization (pp. 312-330). San Francisco, CA: Morgan-Kaufmann.
  11. Heer, Jeffrey and Card, Stuart K. (2003). Information visualization & navigation:  Efficient user interest estimation in fisheye views.  CHI ’03 Extended Abstracts on Human Factors in Computing Systems, 836-837.
  12. Heer, Jeffrey & Card, Stuart K. (2004). DOITrees Revisited: Scalable, space-constrained visualization of hierarchical data. AVI 2004. Proceeding of the Conference on Advanced Visual Interfaces (Trento, Italy),
  13. Kahneman, Daniel (2011). Thinking, Fast and Slow. New York: Farrar, Straus and Giroux.
  14. Lamping, J., Rao, R. and Pirolli, P. A focus + context technique based on hyperbolic geometry for visualizing large hierarchies. CHI '95 Proceedings of the SIGCHI Conference on Human factors in Computing Systems.
  15. Leung, Y. W. and Apperley, Mark (1994). A Review and Taxonomy of Distortion-Oriented Presentation Techniques. In ACM Transactions on Computer-Human Interaction, 1(2): 126-160.
  16. Mackinlay, Jock D., Robertson, George G., & Card, Stuart K. (1991).  The perspective wall: Detail and context smoothly. In CHI ‘91, ACM Conference on Human Factors in Computing Systems. New York:  ACM, 173–179.
  17. Munzner, Tamara, and Burchard, Paul (1995). Visualizing the structure of the World Wide Web in 3D hyperbolic space. Proceedings of VRML ’95, (San Diego, California, December 14-15) and special issue of Computer Graphics, New York: ACM SIGGRAPH, pp. 33-38.
  18. Munzner, Tamara (1998). Exploring large graphs in 3D hyperspace. IEEE Computer Graphics and Applications 18(4):18-23.
  19. Pirolli, Peter, Card, Stuart K., a& Van Der Wege, Mija M. (2003). The effects of information scent on visual search in the hyperbolic tree browser. ACM Transactions on Computer-Human Interaction (TOCHI): 10(1). New York: ACM.
  20. Resnikoff, H. L. (1987). The Illusion of Reality. New York: Springer-Verlag.
  21. Robertson, George G., Mackinlay, Jock D. (1993). The document lens. In ACM UIST ’93, Proceedings of the 6th Annual ACM Symposium on User Interface Software and Technology. New York: ACM, 101-108.
  22. Robertson, George G., Mackinlay, Jock D., & Card, Stuart K. (1991).  Cone trees: Animated 3D visualizations of hierarchical information.  CHI ‘91 ACM Conference on Human Factors in Computing Systems, 189–194.  New York:  ACM.
  23. Sarkar, M. and Brown, M.H. (1994).  Graphical fisheye views, CACM 37(12): 73-84.
  24. Spence, R. (1982). The Bifocal Display. Video, Imperial College London.
  25. Tallmina, Daina  (1997). Crochet model of hyperbolic plane. Fig, The Institute for Figuring. Taken from web page http://www.theiff.org/oexhibits/oe1e.html on June 14, 2012.

7.6 Commentary by Lars Erik Holmquist

When revisiting the original videos by Spence and Apperley, it is remarkable how fresh and practical their ideas still are - and this goes for not just the principles of the Bifocal display itself, but also the human-computer interaction environment that they envisioned. A few years ago I organized a conference screening of classic research videos, including Spence and Apperley's envisionment of a future Office of the Professional. For entertainment purposes, the screening was followed by Steven Spielberg's science fiction movie MINORITY REPORT. In the fictional film, we could see how the hero (played by Tom Cruise) interacted with information in a way that seemed far beyond the desktop computers we have today - but in many ways very similar to Spence and Apperley's vision of the future office. So ahead of their time were these researchers that when these works were shown in tandem, it became immediately obvious how many of the ideas in the 1981 film were directly reflected in a flashy Hollywood vision of the future - created over 20 years later!

It is hard for us to imagine now, but there was a time when the desktop computing paradigm, also called Windows-Icons-Mouse-Pointers or WIMP, was just one of many competing ideas for how we would best interact with digital data in the future. Rather than pointing and clicking with a disjointed, once-removed device like the mouse, Spence and Apperley imagined interactions that are more in line with how we interact with real-world objects - pointing directly at them, touching them on the screen, issuing natural verbal commands. Of the many ideas they explored, the general theme was interaction with large amounts information in ways that are more natural than viewing it on a regular computer screen - something they likened to peeking through a small window, revealing only a tiny part of a vast amount of underlying data.

The Bifocal display is based on some very simple but powerful principles. By observing how people handle large amounts of data in the real, physical world, the inventors came up with a solution for mitigating the same problem in the virtual domain. In this particular case, they drew upon an observation of human vision system - how we can keep many things in the periphery of our attention, while having a few in the focus - and implemented this electronically. They also used a simple optical phenomenon, that of perspective; things in the distance are smaller than those that are near. Later, other physical properties have also been applied to achieve a similar effect, for instance the idea of a "rubber sheet" that stretches and adapts to an outside force, or that of a camera lens that creates a "fisheye" view of a scene (e.g. Sarkar and Brown 1994).

All of these techniques can be grouped under the general term of focus+context visualizations. These visualizations have the potential to make large amounts of data comprehensible on computers screens, which are by their nature limited in how much data they can present, due to factors of both size and resolution. However, powerful as they may be, there are also some inherent problems in many of these techniques. The original Bifocal display assumes that the material under view is arranged in a 1-dimensional layout, which can be unsuitable for many important data sets, such as maps and images. Other fisheye and rubber sheet techniques extended the principles to 2-dimensional data, but still require an arrangement based on fixed spatial relationships rather than more logically based ones, such as graphs. This has been addressed in later visualization techniques, which allow the individual elements of a data set (e.g. nodes in a graph) to move more freely in 2-dimensional space while keeping their logical arrangement (e.g. Lamping et al 1995).

Furthermore, for these techniques to work, it is necessary to assume that the material outside the focus is not overly sensitive to distortion shrinking, or that it at least can be legible even when some distortion is applied. This is not always true; for instance, text can become unreadable if subjected to too much distortion and/or shrinking. In these cases, it may be necessary to apply some other method than the purely visual to reduce the size of the material outside the focus. One example of how this can be done is semantic zooming, which can be derived from the Degree of Interest function in Furnas' generalized fisheye views (Frunas 1986). With semantic zooming, rather than graphically shrinking or distorting the material outside the focus, important semantic features are extracted and displayed. A typical application would be to display the headline of a newspaper article rather than a thumbnail view of the whole text. Semantic zooming is now common in maps, where more detail - such as place names and small roads - gradually gets revealed as the user zooms in.

There have been many approaches that try to mitigate these problems. In my own work, using a similar starting point to Spence and Apperley and also inspired by work by Furnas, Card and many others, I imagined a desk covered with important papers. One or two would be in the center of attention as they were being worked on; the rest would be spread around. However, unlike other bifocal displays they would not form a continuous display, but be made up of discrete objects. On a computer screen, the analog would be to have one object in the middle in readable size, and the others shrunk to smaller size arranged on the surrounding area. By arranging the individual pages in a left-to-right, top-to-bottom fashion it became possible to present a longer text, such as a newspaper article or a book (see figure 1). The user could then click on a relevant page to bring it into focus, or use the keyboard to flip through the pages (Figure 2). This technique was called Flip Zooming, as it mimicked flipping the pages in a book. The initial application was a Java application for web browsing, called the Zoom Browser (Holmquist 1997). Later we worked to adapt the same principle to smaller displays, such as handheld computers. Because the screen real-estate on these devices was even smaller, just shrinking the pages outside the focus was not feasible - they would become too small to read. Instead, we applied computational linguistics principles to extract only the most important important keywords of each section, and present these to give the viewer an overview of the material. This was implemented as a web browser for small terminals, and was one of the first examples of how to handle large amounts of data on such devices (Björk et al. 1999).

Flip zooming view of a large document, with no page zoomed in
Figure 7.1: Flip zooming view of a large document, with no page zoomed in
Flip zooming with a page zoomed in. Note the lines between pages to denote order!
Figure 7.2: Flip zooming with a page zoomed in. Note the lines between pages to denote order!

Another problem with visualizing large amounts of data, is that of size versus resolution. Even a very large display, such as a projector or big-screen plasma screen, will have roughly the same number of pixels as a regular computer terminal. This means that although we can blow up a focus+context display to wall size, the display might not have enough detail to properly show the important information in the focus, such as text. Several projects have attempted to combine displays of different sizes resolutions in order to show both detail and context at the same time. For instance, the Focus Plus Context Screen positioned a high-resolution screen in the centre of a large, projected display (Baudisch et al 2005). This system made it possible to provide low-resolution overview of a large image, e.g. a map, with a region of higher resolution in the middle; the user could then scroll the image to find the area of interest. A similar approach was found in the Ubiquitous Graphics project,where we combined position-aware handheld displays with a large projected display. Rather than scrolling an image around a statically positioned display, users could move the high-resolution display as a window or "magic lens" to show detail on an arbitrary part of the large screen (see Figure 3). These and several other projects point to a device ecology where multiple screens act in tandem as input/output devices. This would allow for collaborative work in a much more natural style than allowed for by the single-user desktop workstations, in a way that reminds us of the original Spence and Apperley vision.

The ubiquitous graphics system provided a freely movable high-resolution display, that acted as an interactive &quot;magic lens&quot; to reveal detailed information anywhere on the larger disp
Figure 7.3: The ubiquitous graphics system provided a freely movable high-resolution display, that acted as an interactive "magic lens" to reveal detailed information anywhere on the larger display

After over 20 years of WIMP desktop computing, the Bifocal display and the ideas derived from it are therefore in many ways more relevant than ever. We live in a world where multiple displays of different resolutions and sizes live side by side, much like in Spence and Apperley's vision of the future office. New interaction models have opened up new possibilities for zooming and focus+context based displays. For instance, multitouch devices such as smartphones and tablets make it completely intuitive to drag and stretch a virtual "rubber sheet" directly on the screen, instead of the single-point, once-removed interaction style of a mouse. I believe that this new crop of devices presents remarkable opportunities to revisit and build upon the original visualization ideas presented in Spence's text, and that we may have only seen the very start of their use in real-world applications.

References

  • Björk, S., Holmquist, L.E., Redström, J., Bretan, I., Danielsson, R., Karlgren, J. and Franzén, K. WEST: A Web Browser for Small Terminals. Proc. ACM Conference on User Interface Software and Technology (UIST) '99, ACM Press, 1999.
  • Baudisch, P., Good, N., and Stewart, P. Focus Plus Context Screens: Combining Display Technology with Visualization Techniques. In Proceedings of UIST 2001, Orlando, FL, November 2001, pp.31-40.
  • Furnas, G.W. Generalized fisheye views. CHI '86 Proceedings of the SIGCHI conference on Human factors in computing systems.
  • Holmquist, L.E. Focus+context visualization with flip zooming and the zoom browser. CHI '97 extended abstracts on Human factors in computing systems.
  • Lamping, J., Rao, R. and Pirolli, P. A focus+context technique based on hyperbolic geometry for visualizing large hierarchies. CHI '95 Proceedings of the SIGCHI conference on Human factors in computing systems.
  • Sanneblad, J. and Holmquist, L.E. Ubiquitous graphics: combining hand-held and wall-size displays to interact with large images. AVI '06 Proceedings of the working conference on Advanced visual interfaces.
  • Sarkar, M. and Brown, M.H. Graphical Fisheye Views. Commun. ACM 37(12): 73-84 (1994)
416 shares
Download PDF

Open Access—Link to us!

We believe in Open Access and the democratization of knowledge. Unfortunately, world-class educational materials such as this page are normally hidden behind paywalls or in expensive textbooks.

If you want this to change, , link to us, or join us to help us democratize design knowledge!